
Phase One Quant Work Summary and Outlook for 2023
The unexamined life is not worth living.
This article first explains why I chose to pursue an alpha strategy, then reviews the first phase of strategy R&D in the second half of 2023, outlines the tasks of phase two, and finally looks ahead to phase three.
Factor Investing
On Conviction and Ideals
The best way to describe sapiens is this: they are storytelling animals.
Yuval Noah Harari
Life needs conviction and ideals. Two and a half million years ago, our ancestors lived on Earth much like other animals. Seven tens of thousands of years ago, human intelligence rose sharply and humanity became the world’s dominant species. With that leap came the capacity for abstract thought through language. Human society is built on abstractions: states, companies, organizations, and many other concepts are not physical objects but shared beliefs living in the minds of large groups of people. Those beliefs make large-scale cooperation possible and have allowed humanity to conquer wilderness and build modern civilization. Belief is therefore both essential and scarce. Every social institution advertises noble values and grand visions, yet few people truly believe them. At the root lies a split between truth and rhetoric. If the real purpose of a state is maintaining the machinery of power through law and institutions, then people cannot sincerely be asked to believe in some vague national dream. If the real purpose of a company is to maximize shareholder value by hiring labor, then employees cannot simultaneously be treated as “human resources” and told they are “masters of the company.” When my daily work is driven purely by salary and I cannot believe in the long-term value of what I am doing, that state of work feels not only inefficient but also like a waste of a finite life.
Yet genuine lofty ideals do exist. Without extraordinary ideals, there are no extraordinary achievements. People are even willing to give up their lives for a final vision, knowing they may never see it realized. For any ideal to be worth believing in, two conditions are necessary: it must be beautiful enough to inspire people, and it must be real enough that they can act on it with conviction.
Quant trading = automatic money printing? The idea of quantitative trading attracted me very early because the vision of “software that makes money automatically” is undeniably beautiful. But beauty alone is not enough. Plenty of people can write code, yet without a guiding framework few can genuinely believe that their program will make money. The more common reality is: “backtests roar like tigers, live trading loses like a dog.” No matter how impressive in-sample returns look, real performance is always worse and can be disastrous. The reason is usually that an “excellent strategy” is a false positive created by multiple testing and excessive mining of historical data, with no predictive power out of sample. That problem of backtest overfitting became my undergraduate thesis topic, and I discussed it in two earlier articles:
- A Simple Introduction to Backtest Overfitting
- Why Live Trading Underperforms Backtests, and How to Test Backtest Overfitting Caused by Multiple Testing
Theory
The turning point came in mid-2022, when I read Dr. Ishikawa’s book Factor Investing. It was the first work to introduce the theory and practice of factor investing to Chinese readers in a systematic way. Compared with most earlier Chinese-language books on quantitative trading, it was on a different level entirely. My first reading was genuinely shocking: I had not realized quantitative investing could have such a rigorous and coherent theoretical foundation. I have gone back to it again and again since then, and each reread still gives me strength.
Multi-factor models are the closest thing to a relative truth for explaining cross-sectional expected returns. Multi-factor theory argues that the expected return of an asset at a point in time depends on its exposure to different factors:
$$ \mathbb E(R_i^e) = \alpha_i + \beta_i \lambda $$
where \(\beta_i\) is the asset’s factor exposure, which can be proxied by company characteristics such as the log of market capitalization for a size factor. \(\lambda\) denotes factor returns, while \(\alpha\) is the part of expected return that the model cannot explain. That is why multi-factor strategies are also called alpha strategies. The multi-factor framework has at least three major advantages:
- It bypasses direct time-series forecasting of asset returns. Accurately timing future market moves at the daily or weekly frequency is nearly impossible. Markets are too complex and samples are too small. Factor models instead focus on relative return across assets, and in principle can produce market-neutral excess return through long-short construction.
- It mitigates the impact of multiple testing. Rule-based strategies often involve only a small number of actions in backtests and easily drift into overfitting. In contrast, factor models explain all samples across all dates. In the A-share market, that means well over one million observations per year, making false discoveries much harder to survive significance testing.
- It is highly extensible. Adding new variables to a factor model is a natural way to improve market understanding. Factor premia can come from risk compensation or behavioral bias. Replacing a linear model with a nonlinear one is also possible when prediction performance demands it.
Take the classic Fama-French three-factor model:
$$ \mathbb E(R_i^e) = \alpha_i + b_m \cdot (R_m - R_f)+ b_s \cdot SMB + b_v \cdot HML $$
Stock returns are explained by the market factor, the size factor SMB, and the value factor HML. That matches intuition: market moves affect individual stocks, and stocks with similar size or valuation often behave similarly over the same period.
How do factor investors generate excess return? One way is to deliberately expose the portfolio to priced factors and earn factor premia, such as allocating more weight to small-cap or low-valuation stocks. A more aggressive source of return is the discovery of private alpha factors. It is hard to believe that the market can be fully explained by only a few variables, and a large empirical literature confirms that multi-factor models carry significant uncertainty and that the sparsity assumption does not really hold. In that sense, empirical asset pricing has already entered the era of high-dimensional factors.
Investors cannot handle that full high dimensionality directly before trading. In practice they price assets with only a small set of covariates. On one side, some variables are expensive to obtain, forcing a trade-off between predictive value and acquisition cost. On the other, limited attention under bounded rationality creates a micro-foundation for simplified valuation. Together, these forces lead investors to use overly sparse valuation models, so assets are not fully and correctly priced.
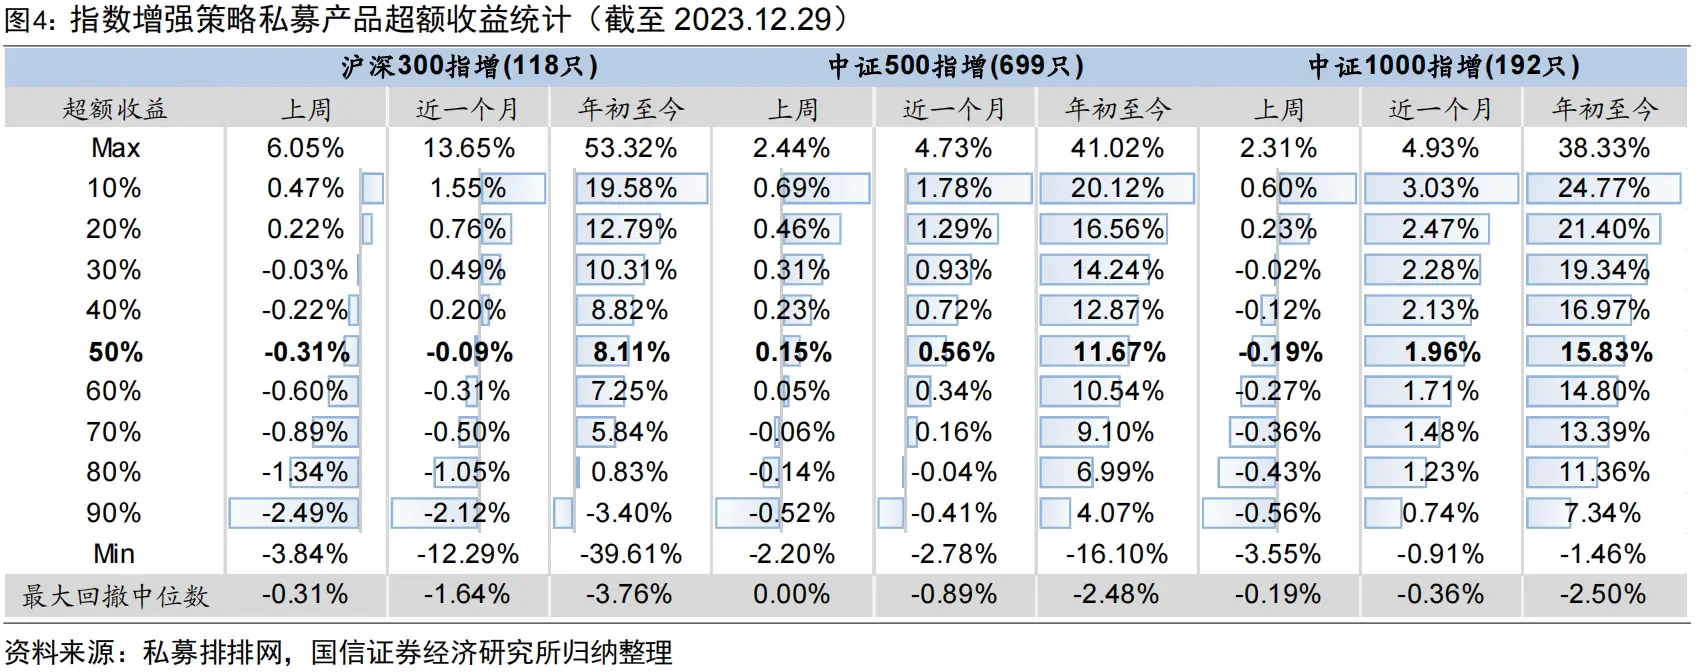
From the industry perspective, factor investing remains the dominant quantitative paradigm in equities. Researchers mine factors by spending labor and exercising creativity, and that process does generate excess return in practice. Looking at the performance of China’s quant industry in 2023, two observations stand out. First, roughly 80% to 90% of market-neutral and index-enhancement funds generated positive excess return. Beating the market is not an act of personal heroism; under the right theoretical framework it is the industry norm. Second, quant strategies performed better in the small-cap universe. The median excess return of CSI 300 enhancement funds was 8.11%, while CSI 1000 enhancement funds nearly doubled that at 15.83%. Even the 90th percentile excess return was 7.83%, with maximum excess drawdown around 2.5%. The reason is that large-cap stocks are more fully priced, while small-cap stocks leave more room for mispricing because investors devote less attention to them.
That raises an obvious question: in a brutal market patrolled by large institutions, is there still room for an individual quant trader to earn excess return? From a macro perspective, discovering and arbitraging private factors takes effort, and the marginal benefit declines. No organization will rationally squeeze every last cent out of the market. Just as the world contains giant supermarkets and tiny convenience stores, or massive software firms and independent developers, a genuinely high-dimensional factor world should allow participants of different sizes to occupy different niches. From a micro perspective, quantitative trading is about exchanging on mispriced chips. As long as there exist counterparties who are more mistaken, or who are forced to trade for other reasons, the game can continue.
Practice
The previous discussion explained where my belief in factor investing came from. This section turns to the implementation path of a concrete alpha strategy.
Alpha strategy = data + factor mining + return model + risk model + portfolio optimization + execution algorithm
A complete alpha strategy begins with data and computed factors. Those factors feed a return model for expected return prediction and a risk model for covariance prediction. Portfolio optimization combines the two and seeks the highest risk-adjusted return. Execution algorithms are then required to minimize trading cost when the strategy is actually traded. Given data availability, market maturity, and my own competitive position, I concluded that A-shares and crypto were both potentially profitable markets.
On strategy construction, Richard Grinold and Ronald Kahn’s fundamental law of active management states that the performance of an active manager, or an equivalent quantitative model, depends on the quality of skill and the breadth of opportunities:
$$\text{IR} = \text{IC} \times \sqrt{\text{BR}},$$
where:
- \(\text{IR}\) is the information ratio, measuring active-management effectiveness;
- \(\text{IC}\) is the information coefficient, the predictive accuracy of the model;
- \(\text{BR}\) is the ratio of opportunity frequency to the observation window.
This formula emphasizes that active management depends on both predictive skill and the number of opportunities available. Institutional investors typically require large capacity, which limits turnover and forces portfolio optimization inside narrow stock universes and weight ranges to satisfy risk control. By contrast, I planned to implement a short-horizon, broad-universe, low-constraint, low-capacity alpha strategy in A-shares, split into the following stages:
- Phase one (
2023.9-2024.1, completed)- Data: daily price-volume data and tick-by-tick trade data
- Hardware: storage and compute
- Software: factor computation, validation, and optimization framework
- Factors: daily and high-frequency price-volume factors
- Phase two
- Return forecasting model
- Risk model
- Portfolio optimization
- Data: fundamentals
- Factors: fundamental factors and behavioral-finance factors
- Phase three
- Programmatic trading
- Trading cost optimization
- Automated AI and factor mining
- Alternative data and alternative factors
The overall workflow can be divided into factor mining, portfolio construction, and programmatic trading. Phase one builds the factor-research framework and populates the factor library with price-volume factors. Phase two adds fundamental factors, builds the return and risk models, constructs portfolios from forecasts, and performs backtesting plus real-time monitoring. Phase three moves to live programmatic trading, optimizes execution cost, and introduces alternative data, alternative factors, and automated AI.
Phase One Review
Hardware and Data Preparation
The first tasks were collecting price-volume data and preparing the hardware needed to store and process it. Low-frequency data came from Tushare. Tick data was purchased from a data vendor. The raw trade feed contains nearly one hundred million matched trades per day, or hundreds of billions per year, occupying roughly 1 TB uncompressed. Processed derivative data is exported in function form, and most expensive intermediate computations are disk-cached at the function-call layer. The hardware stack includes one file server and one compute node, with the main configuration:
- cpu: 13900kf
- ram: 128 GB ddr4
- disk: 4TB ssd*2 raid0
- disk: 16TB hdd*2, up to *5
Factor Mining Framework
High-performance DataFrame Hardware can scale only so far; software efficiency often yields tenfold or hundredfold gains more easily. The factor-investing workflow maps naturally onto dataframe computation. My entire factor research framework is built on Polars. Although it only appeared in 2020, it remains easy to use while reaching top-tier performance, avoiding many of pandas’ weaknesses. Its main features include:
- High efficiency: Polars was designed from scratch close to the machine layer and has no heavyweight external dependency model.
- Ease of use: users write queries naturally while Polars determines the most efficient execution plan through its optimizer.
- Offline processing: the streaming API supports out-of-core data transformation without requiring all data in memory at once.
- Parallel execution: Polars automatically uses available CPU cores with no special configuration.
- Vectorized query engine: Polars is built on Apache Arrow and executes queries in a vectorized way, using SIMD for better CPU efficiency.
High-frequency factor computation The framework supports computing stock-selection factors across the full history from snapshots and tick data using a single-node CPU, with minute-level processing at the raw-data stage and day-level output. To maximize data locality, data is stored by trading day. The first stage processes one day at a time and aggregates it into preliminary daily results; the second stage handles inter-day relationships among those preliminary outputs. Frequently used intermediate results are cached to disk automatically.
Factor hyperparameter search Many factor pipelines contain common or factor-specific hyperparameters, such as how many recent days to aggregate, whether to neutralize by industry, or how thresholds should be set. Manual search is very inefficient, so the framework defines hyperparameter ranges rather than fixed values. Hyperparameters are then chosen automatically through advanced search algorithms in Optuna.
Factor validation Factors are evaluated using RankIC, long-leg return, Sharpe ratio, and similar metrics, broadly consistent with standard practice. One extra point worth mentioning is that I introduced a new correlation coefficient to measure the monotonicity of group returns.
Price-Volume Factors
Factor quality is the core driver of profitability, and implementing technical factors from price and volume data was the main task of phase one. Over recent months, I read and reproduced several hundred financial engineering reports and academic papers, covering most publicly available domestic research from the past decade. Roughly 150 price-volume factors were added to the library. I also organized and published summaries of these factor groups:
- Momentum / reversal factors
- Volatility factors
- Price-volume relationship factors
- Volume factors
- Money-flow factors
Alpha factors, especially high-frequency factors, are kept secret by every serious shop. Nobody openly shares the core of their profitability, so the only option is to build them from scratch. After reproducing so many factors, my biggest impression is that because of academic progress and accumulated market experience, the high-level ideas behind many classical factors are very similar. They are not really secrets. The details of implementation determine final effectiveness, and those are exactly the parts people never talk about. In aggregate, factor performance met expectations, though a large number of factors also failed validation, likely because the prediction horizon had become shorter. For factors with very similar intuition and implementation, I tried to consolidate them and keep only the better version in the library. I also experimented with designing new factors, but most either worked poorly or overlapped heavily with existing ones. At this stage, reproducing existing public research is still the highest-efficiency path, with most improvement coming from implementation detail.
Phase Two Plan
The main task of phase two is to build machine-learning models on top of the factor library established in phase one, aggregate multiple factors, construct portfolios, run backtests and out-of-sample tests, and implement routine updating and monitoring. At the same time, incremental factors such as fundamentals will be added to the library.
Portfolio Construction and Backtesting
Return Model and Model Interpretability
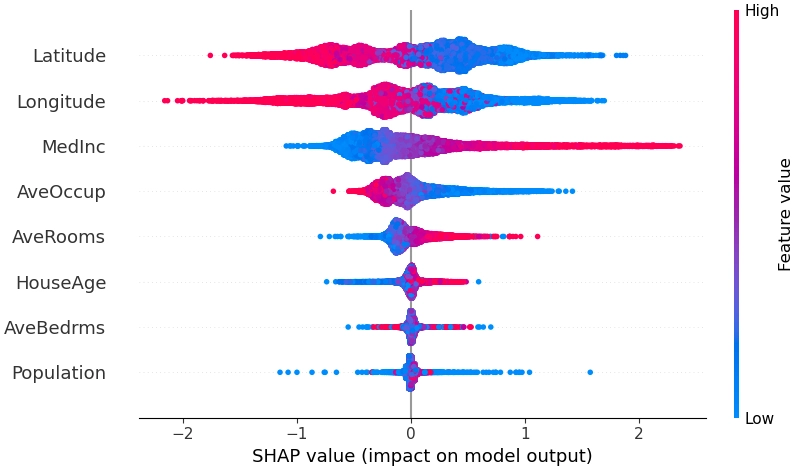
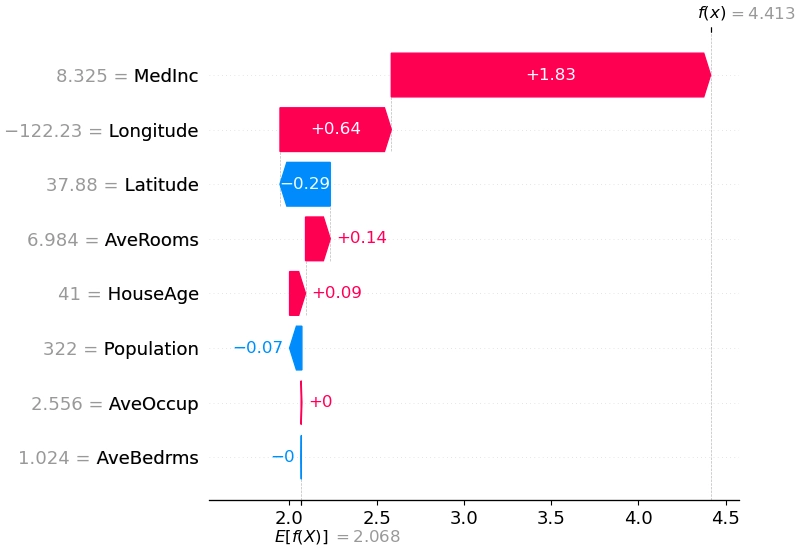
The current plan is to use a gradient-boosted tree model, specifically LightGBM, to predict next-period return. It handles medium-sized, low-dimensional dense problems well and can automatically learn nonlinear interactions among factors, often reaching performance similar to neural networks. Tree models also avoid the inconvenience of manually processing outliers, missing values, and scale normalization. The main optimization direction is to reduce non-i.i.d. issues across time by transforming both features and labels. Hyperparameters such as training-window length, model structure, and loss function will be tuned with Optuna. To avoid turning the strategy into an opaque black box, model interpretability is equally important, and I plan to use shap for both global and local explanations.
I previously hoped to use a ranking-based method, LambdaMART, to handle return ordering directly, but a preliminary attempt showed severe overfitting, so it has been set aside for now. Complex neural models are already heavily studied in academia, and the main room for improvement appears to be in modeling time-varying market structure and stock relationships. I do not expect a large payoff from that line of work yet, so it is also postponed.
Risk Model
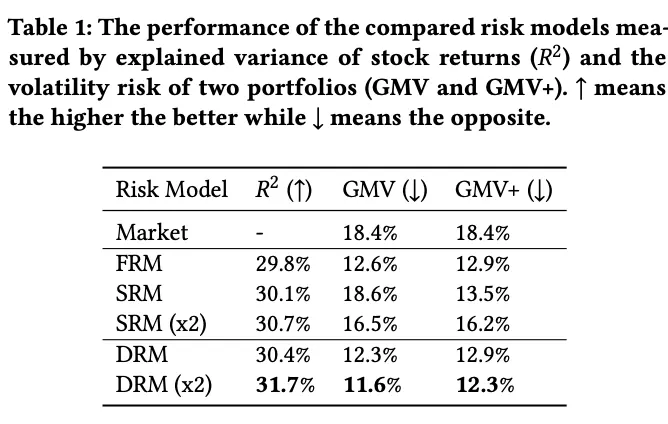
Mainstream risk models can explain roughly 30% of covariance in the equity market. Incorporating covariance information into portfolio construction helps improve the Sharpe ratio. Many PMs buy Barra-style factors, that is, hand-crafted expert factors, as risk models. But first, their performance is not necessarily optimal in the A-share market. Second, because the return model and risk model use different features, part of the true risk is underestimated during optimization. My plan is therefore to build a risk model directly with machine learning. PCA-based matrix factorization is a common baseline for latent-factor mining, but its out-of-sample performance is not especially strong. Microsoft’s 2021 Deep Risk Model (DRM) was the first to formalize risk-factor mining as a supervised learning problem through a custom loss function, and it reported promising results.
Portfolio Construction
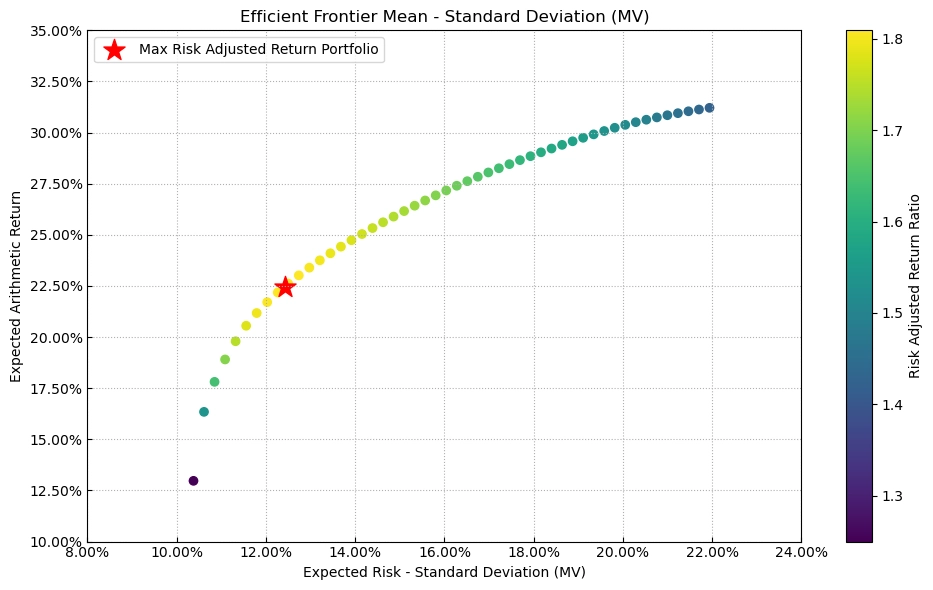
Once expected return \(\mu\) and covariance \(\Sigma\) are available, the next step is to specify the objective and constraints and solve for actual weights. The classical objective is mean-variance optimization:
$$ \max_w {\mu w - \frac{\zeta}{2} w'\Sigma w } $$
In theory, this gives the highest expected return for a fixed risk budget.
After the objective is specified, practical constraints must be added, such as:
- weights summing to one
- industry or single-name weight caps
- turnover limits
- whether short selling is allowed
- holdings-count constraints
- tracking error constraints for index-enhancement strategies
I will not list them one by one here.
Backtesting and Monitoring
Once the above steps are complete, the raw data pipeline can produce a concrete portfolio. The strategy can then be evaluated through in-sample and out-of-sample backtests, together with real-time monitoring of predictive performance.
The monitoring system is planned as a web-based visualization dashboard, likely built on Metabase, covering:
- key factor monitoring
- return and risk model error
- portfolio PnL
Factor Mining
Factor mining will also continue during phase two, mainly in three directions:
Fundamental factors Although fundamental factors are not especially good at predicting short-term stock price moves, they can still provide reliable information to assist model decisions. One example from Factor Investing is the fundamental-anchored reversal factor, which goes long previous losers with strong fundamentals and performs far better than the raw reversal factor. Once fundamental features are included, the return model should learn their interactions automatically.
Behavioral-finance factors In phase one, price-volume factor research was more data-first: if the data and compute existed, then factors of a certain form could be written, validated, and perhaps added to the library. Behavioral finance offers another route. For example, Guojin Securities proposed a “regret-aversion factor”: when the closing price is below the investor’s average purchase price that day, the investor is more likely to keep holding; the larger the share of volume bought above the close and the larger the price deviation from the close, the lower the sell pressure and the higher the expected future return. Conversely, when the closing price is above the day’s average sell price, investors are less willing to buy back; the larger the share of volume sold below the close and the larger the deviation, the weaker the future buy pressure and the lower the expected return.
Supplementary price-volume factors Continue to fill gaps in the current price-volume library by 1. reading additional high-quality brokerage reports and 2. systematically going through the 2023 Factor Calendar and 2024 Factor Calendar.
Phase Three Outlook
Programmatic Trading and Execution Algorithms
The main task of phase three is to run the strategy in live markets. That first requires programmatic trading, likely through QMT. When implementing buy and sell instructions, smart execution algorithms that reduce impact cost will be crucial. Classical approaches include TWAP and VWAP, while frontier approaches such as multi-agent reinforcement learning even claim to make execution itself profitable, though I remain skeptical. Either way, for a medium- to high-turnover strategy, the refinement of the execution algorithm will determine whether the theoretical returns of the factor model can actually be realized.
Automated AI
In Quant4.0 (II): Automated AI and Quantitative Research, I discussed automated factor mining. Phase three will also explore machine-learning factors such as recurrent neural networks or spectral-analysis-plus-decision-tree pipelines. Symbolic factor mining based on genetic algorithms is not currently planned because it greatly increases compute consumption while offering no clear advantage in performance or interpretability.
Alternative Factor Mining
Alternative data and alternative factor mining are always exciting because private information implies trading advantage.
On October 25, 2018, Tesla stock surged 9.14% because the company had released a Q3 2018 earnings report after the previous session that far exceeded Wall Street expectations. The report showed that production of the Model 3 had nearly doubled over the quarter, which gave investors a strong boost of confidence and triggered a market celebration.
Faced with the surge in Model 3 production and the market confidence reflected in the 9%+ rally, Elon Musk was certainly pleased. But he was not the only one. Another group that was probably equally happy was the alternative data company Thasos and many of its hedge fund clients. Before Tesla released the report, they may already have anticipated the result thanks to an information advantage and positioned themselves in advance.
How did Thasos do it?
They built a digital fence around Tesla’s 370-acre factory in Fremont, California, on an online map, isolating smartphone location signals originating from inside the facility. Thasos licensed databases containing trillions of geolocation records collected by smartphone apps and closely monitored phone signals emitted from Tesla’s factory by computer. Using those signals as a proxy, they discovered that from June to October 2018 Tesla’s nighttime shift activity had risen by 30%, implying greater production capacity. Thasos shared the data with some of its hedge fund clients, and it clearly had real value.
From Ishikawa, The Promise and Pitfalls of Alternative Data
Alternative factor mining in phase three can proceed in several directions. Some of these ideas are already common, but because their implementation differs from ordinary price-volume factors, I still classify them as alternative factors:
- northbound-capital follow-the-flow strategies
- analyst expectation factors
- institutional-survey behavior
- event strategies converted into event factors
- relational momentum effects
- sentiment analysis of public opinion, analyst reports, and management communication
- shareholder-count factors
Most of the workload here lies in acquiring alternative data and using AI or other methods to analyze heterogeneous information. Existing reports suggest that alternative data factors do not have especially high standalone IC, but the diversity of data sources may still give them strong incremental value inside a broader strategy.
Phase One Quant Work Summary and Outlook for 2023