Stock Market Fund-Flow Factors from Tick-by-Tick Trade Data: A Long Road Still Ahead
Unlike volume factors, which examine aggregate trading volume over a period, the fund-flow factors in this article are computed from tick-by-tick trade data and study microstructure features created by trading itself, such as whether the counterparty is trading in large or small orders and how posted order sizes are distributed. Tick-by-tick trade data is large enough to create serious engineering challenges for factor computation. This article first introduces a single-machine computation framework and then briefly summarizes the existing research results on fund-flow factors.
A Single-Machine Framework for Tick-Level High-Frequency Factors
If we only consider daily price-volume data for the whole stock market, the amount of data is roughly the number of stocks times the number of trading days. That is barely more than a million rows per year, and factor calculations over several years can be handled comfortably in one table. The high-frequency factors discussed in earlier posts were mostly based on high-frequency snapshots. Because snapshot data can be aggregated easily to the minute level and cached, the data scale rises by two orders of magnitude, but even a few hundred million rows per year is still not too hard for modern processors. Tick-by-tick trade data, however, rises by another two orders of magnitude: close to one hundred million matched-trade records per day, several tens of billions per year, about 1 TB of storage before compression, and at least hundreds of billions of rows to process for a single factor calculation. The format looks like the table below. Each row records one match between a buy order and a sell order, including the limit prices and posted size of both sides, the trade direction, and the traded volume. Since the goal is to study fund-flow characteristics, the records for a given buy or sell order usually need to be aggregated to the order level.
| date | asset | time | Type | Price | Volume | SaleOrderID | SaleOrderVolume | SaleOrderPrice | BuyOrderID | BuyOrderVolume | BuyOrderPrice | |
|---|---|---|---|---|---|---|---|---|---|---|---|---|
| 0 | 2022-01-10 | 000001.SZ | 09:25:00 | B | 17.29 | 100 | 1 | 100 | 15.48 | 1 | 8800 | 18.92 |
| 1 | 2022-01-10 | 000001.SZ | 09:25:00 | B | 17.29 | 300 | 2 | 300 | 15.48 | 1 | 8800 | 18.92 |
| 2 | 2022-01-10 | 000001.SZ | 09:25:00 | B | 17.29 | 1200 | 3 | 1200 | 15.48 | 1 | 8800 | 18.92 |
| 3 | 2022-01-10 | 000001.SZ | 09:25:00 | B | 17.29 | 500 | 4 | 500 | 15.48 | 1 | 8800 | 18.92 |
| 4 | 2022-01-10 | 000001.SZ | 09:25:00 | B | 17.29 | 1700 | 5 | 1700 | 15.48 | 1 | 8800 | 18.92 |
The difficulty of obtaining and processing tick data is high enough to deter most ordinary investors. In theory, that should create an information advantage and an alpha source for professional investors. This section does not judge how much valuable information is hidden in the data. It only discusses how to compute daily stock-selection factors from tick data on CPUs without using a distributed system. Traditionally, TB-scale data is handled with distributed big-data systems, but whether self-built or rented from the cloud, the maintenance and operating cost is hard for individual investors and small institutions to bear. It also creates a split between daily factors and high-frequency factors.
As for why not use GPUs, there are several reasons. First, while GPUs have much stronger floating-point performance than CPUs, GPU memory is limited, so the amount of data they can process at once is often only a fraction of what a CPU-based system can handle. Second, CuDF does not optimize queries. Taken together, those points mean that total wall-clock time is not necessarily better on GPU. Finally, because of microarchitecture differences, GPUs are weaker for double-precision arithmetic and complex operations. The test environment used here was roughly the expansion limit of a consumer PC at the time, in January 2024.
- cpu: 13900kf
- ram: 128 GB 3200Mhz dual channel
- disk: 4TB ssd * 2 raid0
High-performance DataFrame My overall factor research framework is currently built on Polars. As a young DataFrame library born in 2020, Polars preserves ease of use while reaching first-class performance and eliminating many of pandas’ long-standing issues. Its main features include:
- efficient: Polars was designed from scratch close to the machine and has no external dependencies
- easy to use: the user writes queries naturally, while Polars determines the most efficient execution plan through its optimizer
- offline processing: the streaming API supports out-of-core transformations, so results can be processed without requiring all data in memory at once
- parallel processing: Polars divides workloads across available CPU cores without any extra configuration
- vectorized query engine: Polars uses Apache Arrow, a columnar data format, and vectorized execution with SIMD to optimize CPU usage
A two-stage intraday/interday pipeline To take full advantage of data locality, the framework stores data by trading day. In the first stage it processes one day’s data and aggregates it into preliminary daily results. In the second stage it handles interday relationships among those preliminary results. This design greatly improves performance and lowers peak memory usage.
Caching and sampling Operations such as “aggregate to the order level” are very frequent, so the framework caches intermediate results on disk. To provide fast feedback after factor modifications and improve research efficiency, it also supports 10% sampling of order data. In practice the difference from full-sample computation is small.
| date | scmc | SaleOrderID | time | OrderVol | OrderPrice | Volume | Amount | ActiveAmount | ActiveVolume | OrderAmount | |
|---|---|---|---|---|---|---|---|---|---|---|---|
| 0 | 2022-01-10 | 000001.SZ | 4 | 09:25:00 | 500 | 15.48 | 500 | 8645 | 0 | 0 | 7740 |
| 1 | 2022-01-10 | 000001.SZ | 11 | 09:25:00 | 200 | 15.48 | 200 | 3458 | 3458 | 200 | 3096 |
| 2 | 2022-01-10 | 000001.SZ | 24 | 09:25:00 | 100 | 15.48 | 100 | 1729 | 1729 | 100 | 1548 |
| 3 | 2022-01-10 | 000001.SZ | 56 | 09:25:00 | 1000 | 15.48 | 1000 | 17290 | 17290 | 1000 | 15480 |
| 4 | 2022-01-10 | 000001.SZ | 61 | 09:25:00 | 1800 | 15.48 | 1800 | 31122 | 31122 | 1800 | 27864 |
Fund-Flow Factors Based on Tick Data
After overcoming the engineering barrier to factor computation, the results of fund-flow factors are best described as mixed. On the whole, for short-horizon prediction of less than a week, the information coefficient of fund-flow factors is much weaker than that of simple daily factors such as turnover and short-term reversal, and their alpha source is not clean or obvious. A small comfort is that technical factors often get most of their returns from the short side and therefore have limited practical value, while this phenomenon is less severe for fund-flow factors.
Order Distribution
Once buy-order and sell-order data are available, it is natural to compute distributional features from them. The cross-sectional distribution of stock orders in a single day is approximately Pareto, so comparing ratios of quantiles is equivalent to comparing distribution parameters. Factors built this way show significant stock-selection ability: the more uneven the distribution, the larger the expected future return. Similarly, one can compute the information entropy of the order distribution, and that factor has significant negative stock-selection power.
Large-Order Impact
Factors such as “deviation of the average buy price of large orders” and “price increase pushed by large orders” both describe the price impact of large-order buying. Upward price pressure caused by large orders has very strong negative stock-selection power, though long-side returns are weak. This finding was first proposed by the Kaiyuan Securities team in their work on improving reversal factors.
Differences Between Large-Order and Small-Order Fund Flows
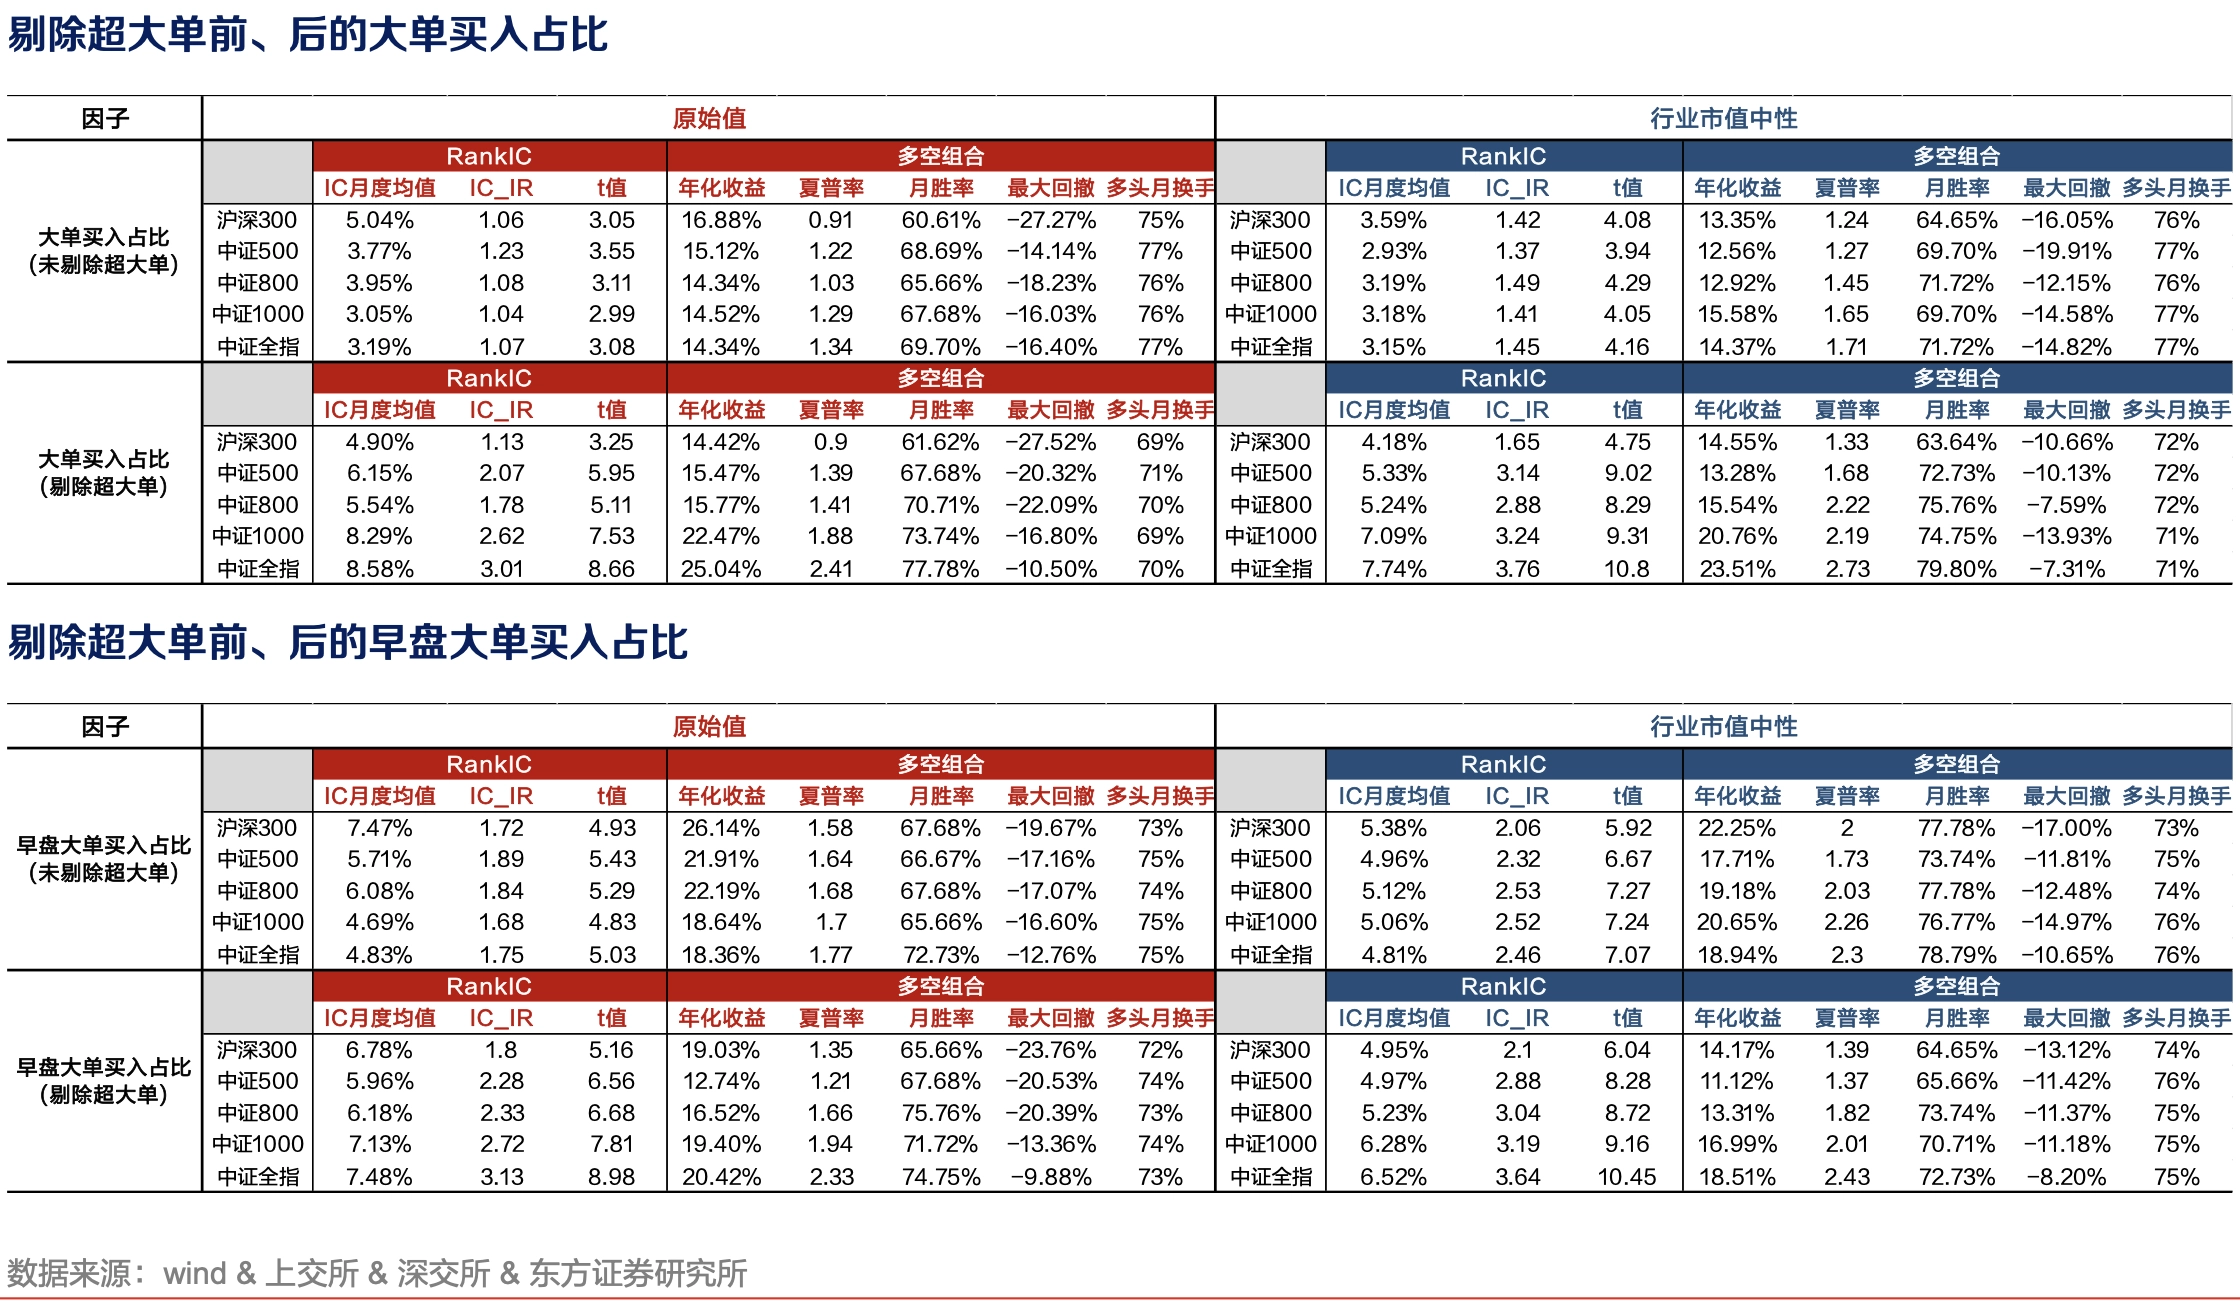
The usual view is that large orders correspond to “informed or dominant money” while small orders correspond to retail investors. Large-order fund flow has positive stock-selection power, while small-order fund flow is a contrarian indicator. The ways of measuring this anomaly are much less unified and clear than those of other anomalies. Different research teams use different definitions and processing rules. For example, Kaiyuan Securities proposes a factor based on the intensity of large-order and small-order fund flow, calculating medium-and-large-order net inflow and small-order non-aggressive net inflow intensity, then removing correlation with reversal factors to improve performance. Orient Securities calculates the proportion of large-order buying after excluding extremely large orders. Similar factors include the share of aggressive small-order buying and aggressive net inflow by small orders.
Price-Fund-Flow Interactions
Just as price-volume relationships are worth studying, the relationship between fund flow and price also matters. Huatai Securities focuses on “the sensitivity of fund-flow changes to individual-stock returns.” Their concrete steps are:
- compute the daily return of each stock
- compute the daily rate of change in stock-level fund flow, with 5MAD cross-sectional winsorization
- for each stock, compute the beta of daily return relative to the daily rate of change in fund flow over the past 20 trading days using OLS
Across different fund-flow categories, trade directions, and cash units, these factors show significant negative stock-selection power in the full market. In other words, stocks whose returns are less sensitive to changes in fund flow earn excess returns relative to stocks whose returns are more sensitive.
Kaiyuan Securities also proposes the “retail herding effect,” measured as the rank correlation between intraday return on the current trading day and next-morning net inflow by small orders. The factor is intended to capture the tendency of retail traders to chase stocks that performed well yesterday.
Conclusion
Because factor computation is complex and the direction of factor discovery remains uncertain, research on fund-flow factors based on tick-by-tick data has stayed relatively quiet. The public factors that do exist are fragmented and their performance is only mediocre. My own judgment, however, is that this is still a relatively blue-ocean area. To mine factors that can match the effectiveness of traditional directions, we will need deeper microstructure analysis and fresh financial theory. Another important direction is interaction between fund-flow features and other factors. For example, the Kaiyuan Securities team uses large-versus-small-order ratios to “slice” reversal factors, while Guojin Securities uses small-order data to strengthen regret-aversion factors. The paradigm of “fund flow + X” should be broadly applicable to mining mispricing created by behavioral bias.
Stock Market Fund-Flow Factors from Tick-by-Tick Trade Data: A Long Road Still Ahead