Momentum and Reversal Together: Two Unified Frameworks for Trend Factors
The short-term reversal effect is the same as the small market capitalization factor. It has steadily contributed significant excess returns over a long period of time in the past. A single factor alone can achieve an annualized rate of return of 40%+. Unfortunately, the good times did not last long. Since 2019, the performance of the reversal factor has been extremely unstable, with large retracements, poor long-term monotonicity, and even momentum effects in some time periods and in the index domain. So has the short-term reversal effect degenerated into a style factor? How to improve the reversal factor, and in factor investment practice, can momentum and reversal be treated uniformly under the same framework? This article introduces the optimal construction of inversion factors and summarizes two unified frameworks.
Momentum and Reversal
De Bondt, and Thaler (1989) pointed out that investors often make judgments based on simple empirical rules when making decisions, and therefore often overestimate the impact of recent events and underestimate the long-term impact of past events. Therefore, investors tend to overreact to short-term news, which leads to subsequent price reversal. The short-term reversal anomaly was first proposed. The phenomenon of chasing the rise and killing the fall is particularly common in the A-share market, and the reversal effect is very significant. You can steadily obtain excess returns by going long on stocks that have fallen sharply in the early stage before 2019. Short-term reversal factors are usually constructed using the most recent 20-day (one-month) return rate.
In 1967, Robert Levy proposed using the relative strength of stock price changes as an important criterion for stock screening. In 1993, Jegadeesh and Titman once again mentioned in their groundbreaking research that “the strong always get stronger” that has existed in the US stock market for a long time, that is, the momentum effect: a phenomenon in which stocks that have risen more in the early stage (winners) have higher expected future returns, while the losers group have lower expected returns. In order to eliminate the impact of short-term reversal effects, the momentum factor is generally calculated using data from the past 12-1 months, that is, skipping the most recent month. Compared with the reversal effect, the momentum effect that has existed for a long time in the markets of developed countries is hard to find in the Chinese and Japanese stock markets. However, in recent years, as the institutionalization process of A-shares has accelerated, the momentum effect has appeared in stocks with large market capitalization and large institutional holdings.
From the perspective of investor behavioral bias, if the ** stock price reversal anomaly comes from investors’ overreaction, then the momentum effect is due to investors’ underreaction to new information**. This hypothesis is well supported by the surplus momentum anomaly. Another explanation is that investors use in-sample data to extrapolate future stock price performance, and this naive estimate is too simple and sometimes naive.
In terms of factor structure, simple reversal factors such as daily-level changes in 5-day yields and deviations from the 10-day moving average have good backtesting performance. Common momentum factors such as mid-term momentum, idiosyncratic momentum, moderate earnings momentum, etc. are not significant, and only the Earnings Momentum related factor is significant. Kishore and Brandt (2008) were the first to capture the market’s reaction to unexpected earnings information through excess returns before and after earnings announcements. The EAR indicator constructed in this way can not only capture the company’s unexpected information on profits, but also capture the market’s reaction to the company’s unexpected revenue capabilities, sales revenue, investment returns and other intangible information. For example, the EAR factor uses the cumulative excess returns of listed companies for a total of three days from the day before to the day after the earnings announcement to construct the excess return index before and after the earnings announcement, and the AOG factor uses the degree of gap after the earnings announcement as the momentum factor. Generally speaking, a higher opening after an earnings announcement usually corresponds to good news for the market (such as earnings reports exceeding expectations, a surge in quarterly profits, and analysts raising profits), while a lower opening after an earnings announcement usually corresponds to negative news for the market (such as earnings lower than expected, earnings falling, analysts lowering profits).
Momentum and reversal are contradictory and inseparable. Below are two frameworks that attempt to unify the two.
Cumulative income split
Time division
“Overnight returns are biased towards momentum, while intraday returns are biased towards reversal” describes the different properties of day and night returns. The overnight momentum factor does show a certain momentum effect; intraday returns show a stronger reversal effect, which is an improvement on the original reversal factor.
$$ OverNightMom = \sum_i{ln(\frac{open_i}{close_{i-1}})} \newline IntradayMom = \sum_i{ln(\frac{close_i}{open_i})} $$
The magnitude (absolute value) of the overnight rise and fall is a significant reversal factor. Stocks that open low/open high with an excessive range have lower expected returns. Furthermore, Huaan Securities pointed out that although the half hour before the opening is also an intraday period, it is also a continuation of the overnight rise and fall. The reversal nature of returns is not obvious. Excluding this period when calculating intraday reversal can improve performance.
Degree division
As done in Intraday High Frequency Volatility Decomposition, intraday high frequency returns can be divided into moderate returns and extreme returns based on the amplitude of the fluctuations. Among them, moderate returns show weaker momentum characteristics, while extreme returns have stronger reversal characteristics. It is worth mentioning that in the minute rate of return, Guosheng Securities only considers the bar with the largest intraday rate of return and finds that it has strong reversal characteristics. It can construct a significant daily frequency stock selection factor using only one minute of data.
Introducing fund information
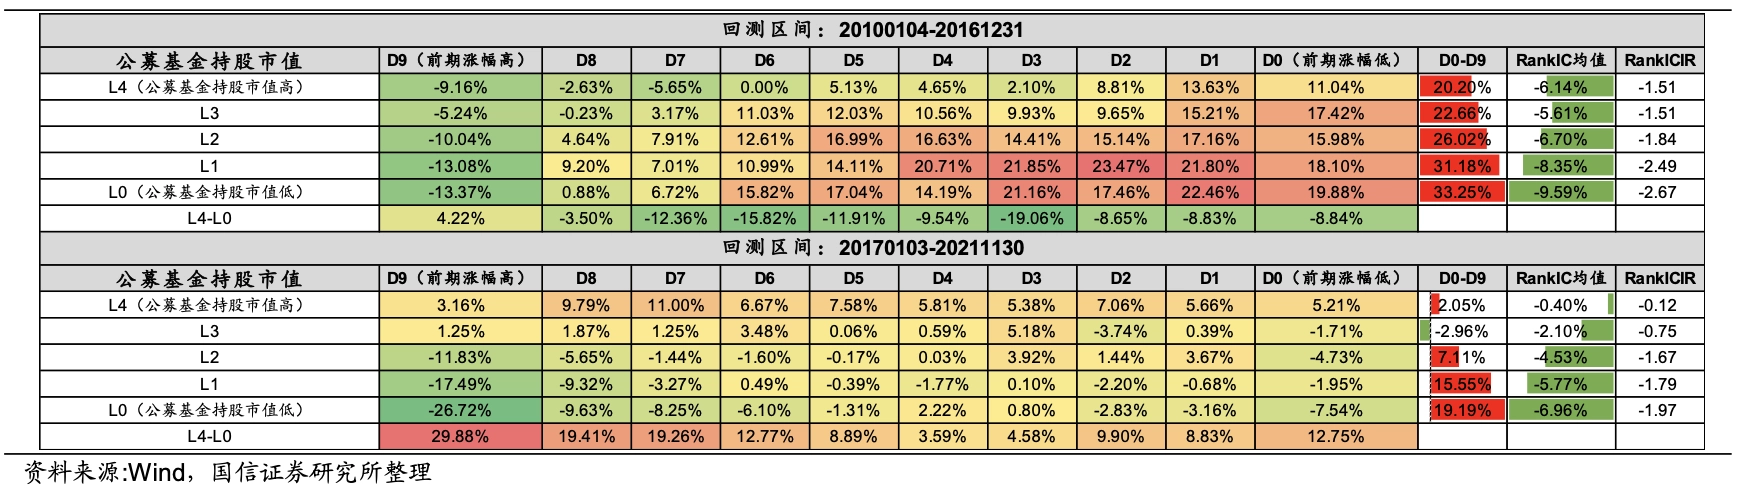
In addition to dividing the rate of return according to time and amplitude, capital information can also be used to correlate different properties of the rate of return, such as calculating the cumulative rate of return within the day based on volume weighting. Kaiyuan Securities proposed that large order transactions are the source of the reversal power of A-shares: large orders reflect the overreaction of the market, and are more likely to reverse later. Therefore, we can count the proportion of daily large and small orders to help judge future trends, or calculate the rate of return during periods when there are more large orders as an improved reversal factor.
UMR Framework
Yang Yiling proposed the Unified Momentum Reversal framework UMR (Unified Momentum Reversal), which divides the nature of daily returns by introducing risk indicators and uses a single factor to closely combine momentum and reversal effects.
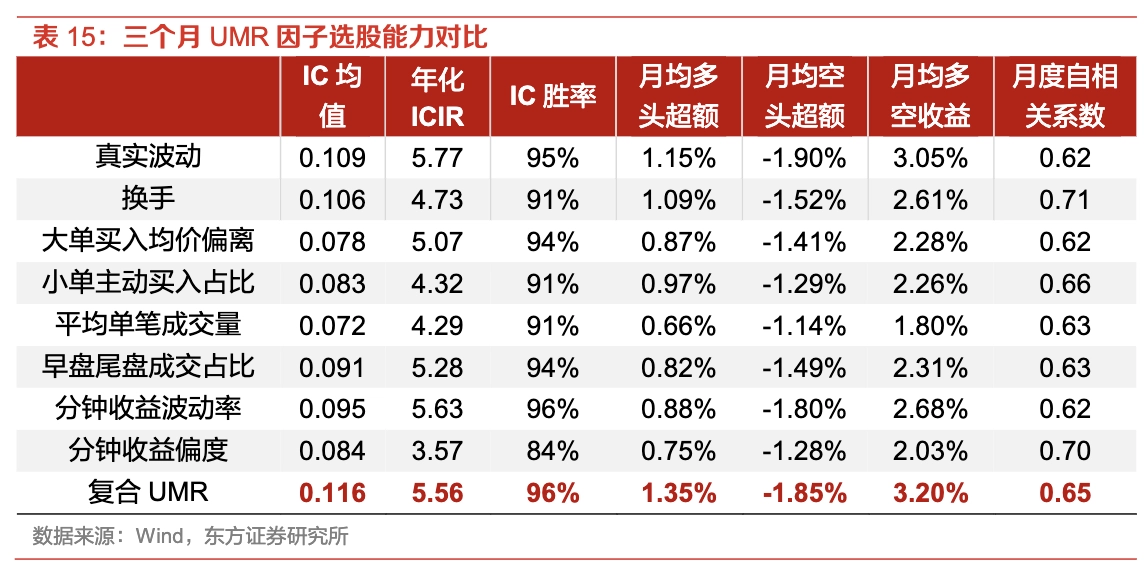
The general idea of UMR is “high risk day bias to reversal, low risk day bias to momentum”. The returns obtained on high-risk days are often brought about by taking risks, which are more due to price overreaction caused by investors’ overconfidence, so they are more inclined to the reversal effect in the future, while the returns obtained on low-risk days are not due to taking high risks, so they are more inclined to the momentum effect in the future. We weight the daily premium of individual stocks with the time series mean adjusted risk indicator, and use this to construct a unified momentum reversal factor. These risk indicators include but are not limited to:
- Volatility
- Real volatility
- standard deviation of minute returns
- Minute return skewness
- For more risk measures, see Low Risk Anomalies, Intraday High Frequency Fluctuation Decomposition
- Turnover rate
- Fund flow
- Deviation from average price of large orders
- Proportion of small order purchases
- Average single transaction volume
- Proportion of early and late trading transactions
$$Risk_{i} = \frac{\Sigma_{j=i-d+1}^{i} R_{j}}{d}-R_{i} $$
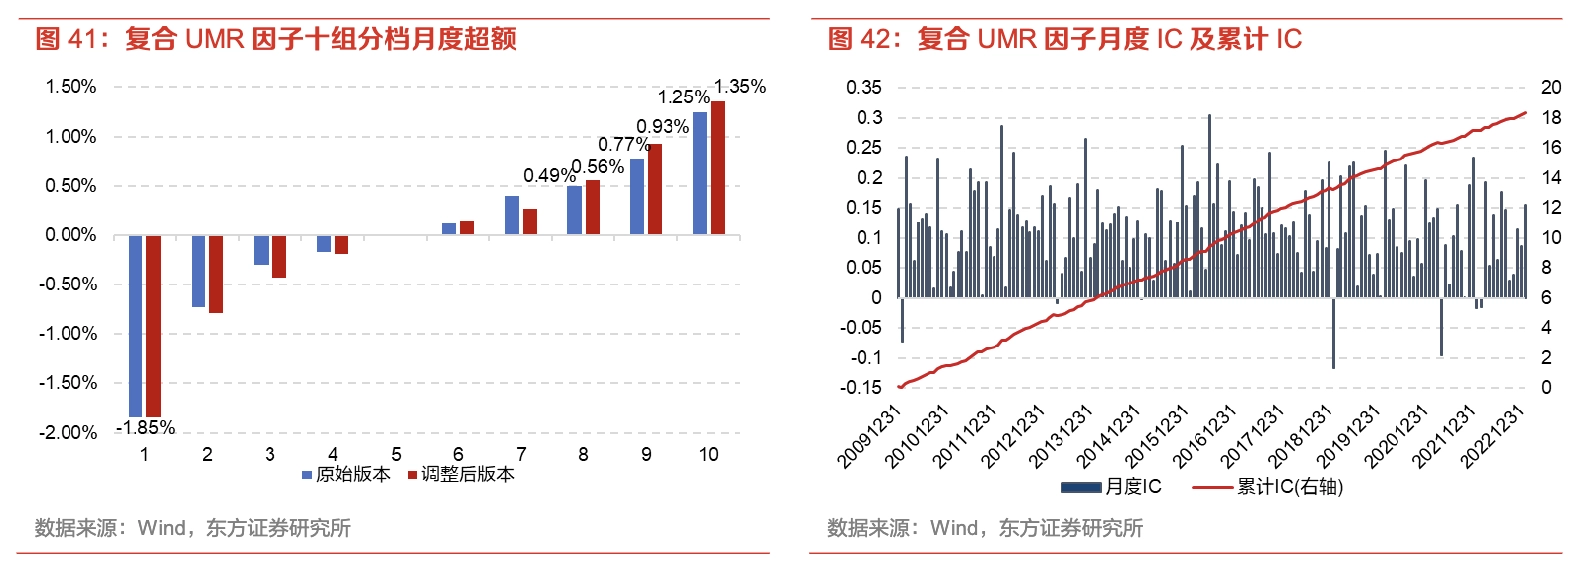
After selecting the risk factor, the weighted average daily excess return is used to obtain the UMR factor. Under monthly swapping, its rankic is as high as 0.1 or more.
$$f_{t}=\sum_{i=t-m+1}^{t} w_{i} \cdot Risk_i\cdot\left(r_{i}-m k t_{i}\right)$$
In UMR2.0, the author has added some patches: Momentum does not necessarily appear on low-risk days, and reversals do not necessarily appear on high-risk days. At some special points, such as earnings announcement days, one-line limit-down days, and rebound momentum days, the returns on that day may be more momentum-biased. In addition, the factors will also be affected by the style of the proportion of high-risk days and the proportion of high-excess days in the window. Therefore, we introduce special date processing, risk factor stripping, and minute high-frequency processing.
Momentum and Reversal Together: Two Unified Frameworks for Trend Factors