
Winning by Orthodoxy and Surprise: A Forward Look at Alternative Factor Mining
As China’s quantitative investment industry and market environment have matured, traditional pricing factors derived from price and volume data have been mined extensively. Hundreds or even thousands of public research reports have already been published, and some hedge funds even claim to hold tens of thousands of factors. Yet these star-like factors are only different quantitative manifestations of a few underlying forces, such as the illiquidity premium and the idiosyncratic volatility anomaly. They cannot diversify risk when the market enters unusual regimes. In extreme episodes, such as February 2024, most price-volume factors fail or reverse together, causing even larger swings for investors. The performance of domestic quant funds this year has illustrated exactly that. From this angle, these alpha factors are really just special forms of beta.
To obtain genuinely independent excess returns, quantitative researchers have to do the core job of value discovery and develop new factors. There are three main routes:
- introduce new data
- apply new processing methods
- improve existing factors
Among these three sources of new factors, this article focuses on building alternative factors from new data plus new methods in order to capture mispricing caused by investors’ limited attention. Concretely, I split the discussion into similarity momentum and text analysis.
Similarity Momentum
Lead-Lag Relationships
Because modeling and computation are complex, most factors use only single-stock data and rarely consider relationships between stocks. Even when they do, the connection is usually treated as an improvement to the return model rather than as an object with its own financial meaning. As a representative form of quasi-alternative data, lead-lag relationships between firms’ returns capture the spillover of momentum across similar stocks.
| Literature | Effect |
|---|---|
| Hou (2007) | intra-industry effect |
| Cohen and Frazzini (2008) | supplier-customer effect |
| Cohen and Lou (2012) | conglomerate lead-lag effect |
| Lee et al. (2019) | technological links |
| Parsons, Sabatucci and Titman (2020) | geographic lead-lag effect |
| Ali and Hirshleifer (2020) | shared analyst coverage |
These papers show from different angles that returns are linked across firms. The excess returns created by those links come from underreaction caused by investors’ limited attention to related information. Following the model set by “Technological links and …”, this line of research has flourished and become a mainstream paradigm for mining alternative factors.
A Unified View
The idea that similar stocks influence future performance rests mainly on three lines of reasoning:
- Investors believe similar stocks should behave similarly, so they infer one stock’s future performance from the past returns of similar stocks.
- If a stock has already performed well and investors missed it, they look for similar stocks that have not yet risen much. In other words, demand increases for stocks that resemble recent winners.
- If investors made money in one category of stocks, path dependence affects their thinking and they keep searching for similar names afterward.
The available empirical evidence suggests that this logic also holds in A-shares, and perhaps even more strongly there. After all, it is a market where “room-temperature superconductivity” can turn a maker of computer cooling products into a soaring “superconductor concept” play. A well-known analyst, Zhu Jiantao, once put it this way:
Stock moves are not independent. They are rotated and speculated on through concepts and sectors. When most stocks in a sector have recently performed well, the laggards in that sector tend to have catch-up demand. Conversely, when a concept sector has broadly fallen, the remaining names that have not yet dropped tend to face catch-down pressure. Based on this logic, if a stock has recently underperformed its similar peers, it may have short-term catch-up demand and positive excess returns. If it has recently outperformed its peers, it may face short-term pressure and contribute negative returns.
Under this unified view, similarity momentum is equivalent to the nearest-neighbor algorithm KNN, and its construction can be broken into three steps:
- Define the relationship between stocks in one of three ways.
- The simplest case uses a known industry classification or concept set and takes all other names in the same set.
- An adjacency matrix can define the relationship jointly for both firms, such as whether the same analyst has written reports on them.
- Embeddings can define stock attributes from their own information, such as historical price series or financial-report text.
- Search for the K nearest neighbors, possibly using approximate methods.
- Use the performance of the K neighbors over the past N days together with the stock’s own performance to compute the similarity momentum factor = weighted neighbor average - own performance.
A note on graph neural networks In recent years, graph neural networks have been widely used to mine stock relationships. My view is that they make sense at the return-model or risk-model level, but they are not well suited to handing the whole similarity-momentum task over to a black-box model.
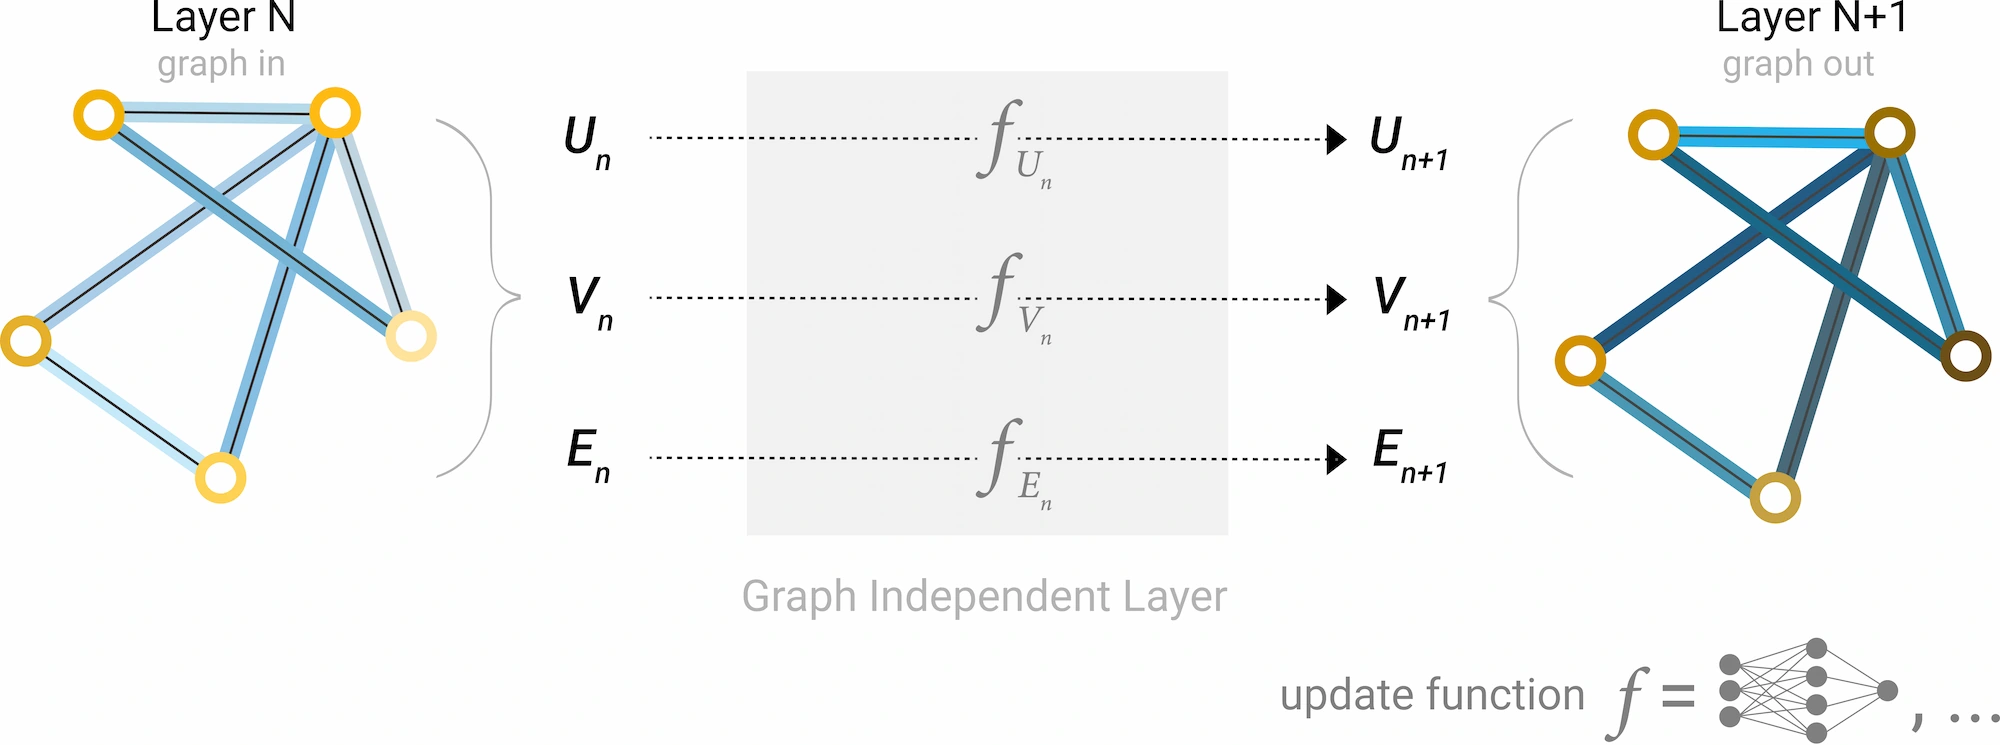
- Interpretability Integrating more data and heterogeneous edges into a single graph can uncover more complex internal links, but it becomes hard to monitor whether an individual factor is effective.
- Computational complexity KNN factor construction requires no training and has a large computational advantage over neural networks that can take hours or days to train.
- Generalization KNN uses less data and stronger priors, so it is less prone to overfitting. When edge counts differ sharply across nodes and relationships change over time, it should in theory generalize better than a neural network.
In short, I advocate using KNN to build basic, statistically meaningful similarity-momentum factors, while graph neural networks can be used at the model layer to integrate those base factors and mine deeper latent relationships, including momentum spillovers that have not yet been discovered.
Defining Similarity
- industry or concept sectors
- directly computed adjacency matrices
- mutual fund holdings
- shared analyst coverage
- institutional surveys
- common northbound holdings
- distance defined by embeddings
- historical return series
- low-dimensional fundamental factors
- fund-flow features
- revenue similarity across firms
- patent data
- stock-name and ticker similarity (yes, there is even a JFE paper called Attention Spillover in Asset Pricing)
Text Analysis
Applying NLP techniques to massive amounts of financial text is another clear strength of computers.
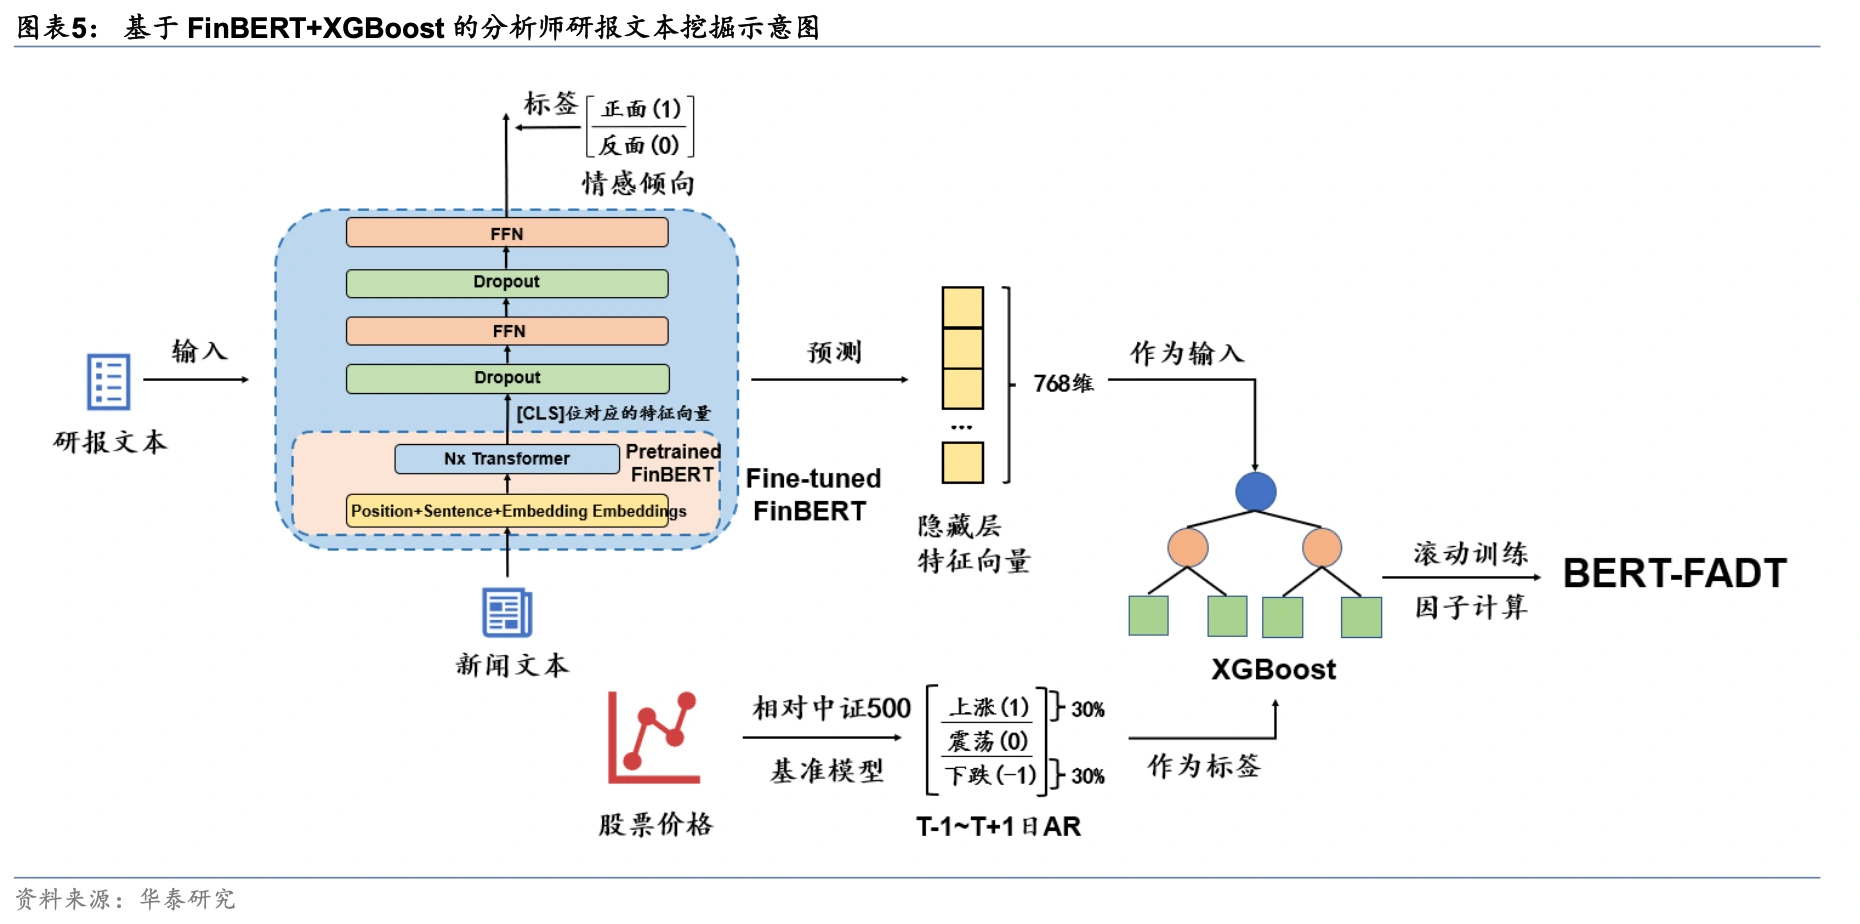
Intuitively, investors cannot track thousands of stocks every day. Limited investor attention means they operate with a finite choice set, and popular stocks attract large inflows under the pull of attention. When some stocks attract more market attention, prices may react too quickly in the short run and become overvalued, lowering future returns. By contrast, stocks with favorable news can be temporarily undervalued because investors neglect them, and then earn returns as that information diffuses gradually. In this direction, analyst-report factors have already achieved good results, such as analyst-report stock-selection factors built with FinBERT by Huatai Securities.
Text analysis of analyst reports is essentially about identifying the stocks that professional investors favor more and uncovering latent value. On the other side, we can also model the attention of noise traders, for example by building negative factors from forum popularity and forum sentiment intensity. Quite a few papers and sell-side reports have already analyzed forum opinion, but most of them stay on the old path of sentiment classification, and the final portfolio results are rarely significant. I believe there is a great deal of room for improvement here. The emotions of noise traders are heavily influenced by the current tape and are only weakly related to expected returns, so the modeling approach needs to be reconsidered from the ground up. In addition, disagreement in investor comments is a natural indicator of heterogeneous beliefs and can be used effectively to forecast volatility.
Financial text analysis can also be combined with existing methods. For example, an improved version of technological links can use similarities based on patent-text embeddings rather than simple patent classifications. Another example is to extract operating information from corporate announcements, compute document vectors, and then use the DRM model to build risk factors: firms with similar businesses should also have similar future performance. Natural language processing extends traditional factor analysis and machine-learning methods into a much wider set of scenarios.
Winning by Orthodoxy and Surprise: A Forward Look at Alternative Factor Mining