
A New Branch of Price-Volume Factors: An Introduction to Idiosyncratic Risk Factors
Ke Yun has special flowers in recent years, often growing into new branches.
The anomaly of low volatility (low risk) is a well-known anomaly prevalent in the global secondary market, and the idiosyncratic risk (idiosyncratic volatility) factor calculated based on idiosyncratic rate of return is an outstanding representative among them. After excluding the impact of systemic risk factors, the residual return rate of individual stocks is considered to better represent risk, and the factors constructed from this also have better performance. Under the implicit factor framework, this article introduces the theoretical basis of idiosyncratic volatility factors, empirical evidence in the A-share market, and subsequent improvement ideas.
The mystery of trait fluctuations
In traditional asset pricing theory, idiosyncratic risks that cannot be explained by systemic risk factors do not carry a risk premium—investors can eliminate these risks through sufficient diversification. However, since the significant negative correlation between idiosyncratic volatility (IVOL) and future returns was proposed in 2006, a large number of empirical studies have supported the existence of this phenomenon. This anomaly is called the “idiosyncratic volatility puzzle”.
Literature [1] gives a widely accepted explanation from the perspective of pricing efficiency and arbitrage asymmetry: First, higher IVOL means higher arbitrage risk, making it impossible to fully eliminate mispricing. Second, investors’ arbitrage of wrongly overvalued/undervalued stocks is asymmetrical, and high-priced stocks are more difficult to short. Therefore, in the entire market, IVOL and expected returns show a negative correlation. The figure below shows that grouped by mispricing levels, the more overvalued the group, the stronger the idiosyncratic fluctuation anomaly is, while in the undervalued group, the relationship reverses to a positive correlation. Similar conclusions are reached in the A-share market, but there is no reversal to a positive correlation.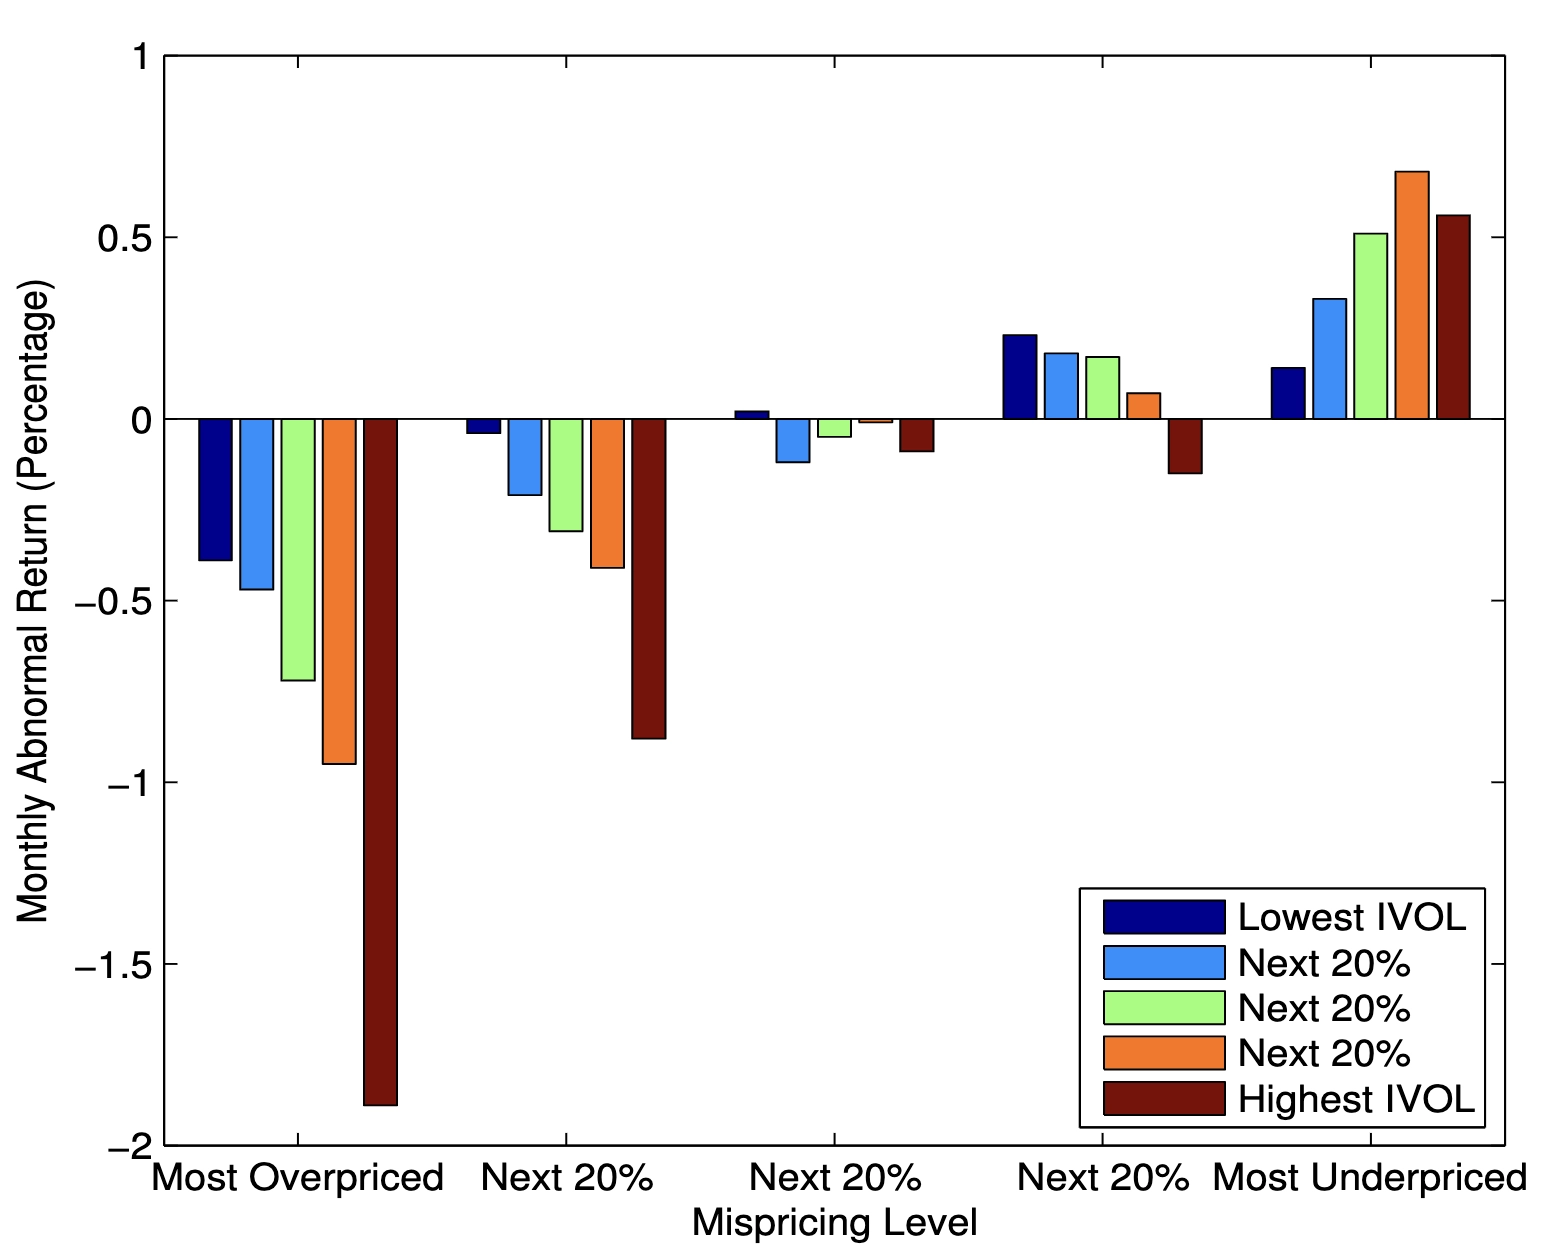
Empirical Research on A Shares
Trait factors under the implicit factor framework
The traditional calculation method of idiosyncratic rate of return is to use the daily frequency rate of return of individual stocks to regress the factor model (CAPM, FF3, FF5), and take the residual as the idiosyncratic rate of return.
$$ r_{i,t} = \alpha_i + \Sigma_j{\beta_{j,t}F_{j,t}} + \epsilon_{i} $$
Among them, r is the return rate of individual stock i, and \(\epsilon\) is the idiosyncratic return rate (idiosyncratic risk) of individual stock. In such a method, we will face problems such as missing factors when selecting factor models, or weak explanatory power. Therefore, Guosen Securities [2] proposed calculating idiosyncratic factors under the implicit factor framework. Specifically, principal component analysis (PCA) is used to directly decompose the rate of return matrix, and the first n eigenvalues are taken as system risk factors.
Daily frequency idiosyncratic factors
The composite idiosyncratic factors under the implicit factor framework outperform the idiosyncratic volatility factors under the traditional multi-factor framework in terms of IC, ICIR and long-short return performance. In addition, since there is no need to go through processes such as presetting factors and building simulated combination backtests, the implicit factor framework is also simple in practical operation.
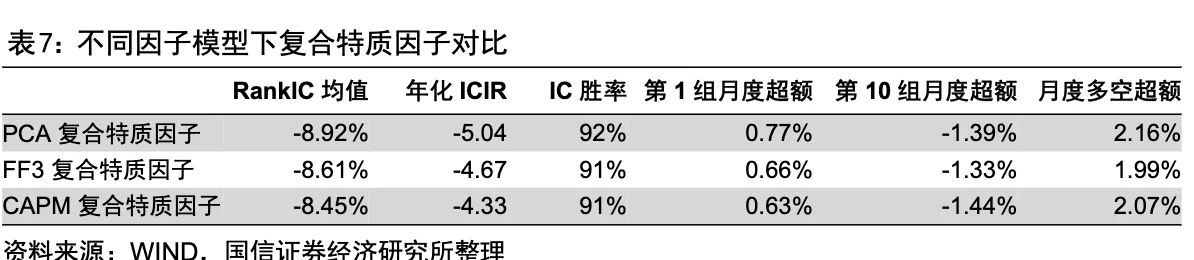
Guoxin [2] synthesized the weights of idiosyncratic fluctuation, specificity, idiosyncratic skewness factors under the implicit factor framework, and constructed a composite idiosyncratic factor under the implicit factor framework. The average RankIC of this composite trait factor is -8.92%, the annualized ICIR is -5.04, and the monthly win rate is 92%. The average monthly excess return of the first group is 0.77%, the average monthly excess return of the tenth group is -1.39%, and the average monthly excess return of long and short is 2.16%. The composite trait factor shows very strong predictive power and stability, better than a single factor and better than the Fama-French three-factor composite trait factor under the explicit factor framework.
High-frequency trait factors
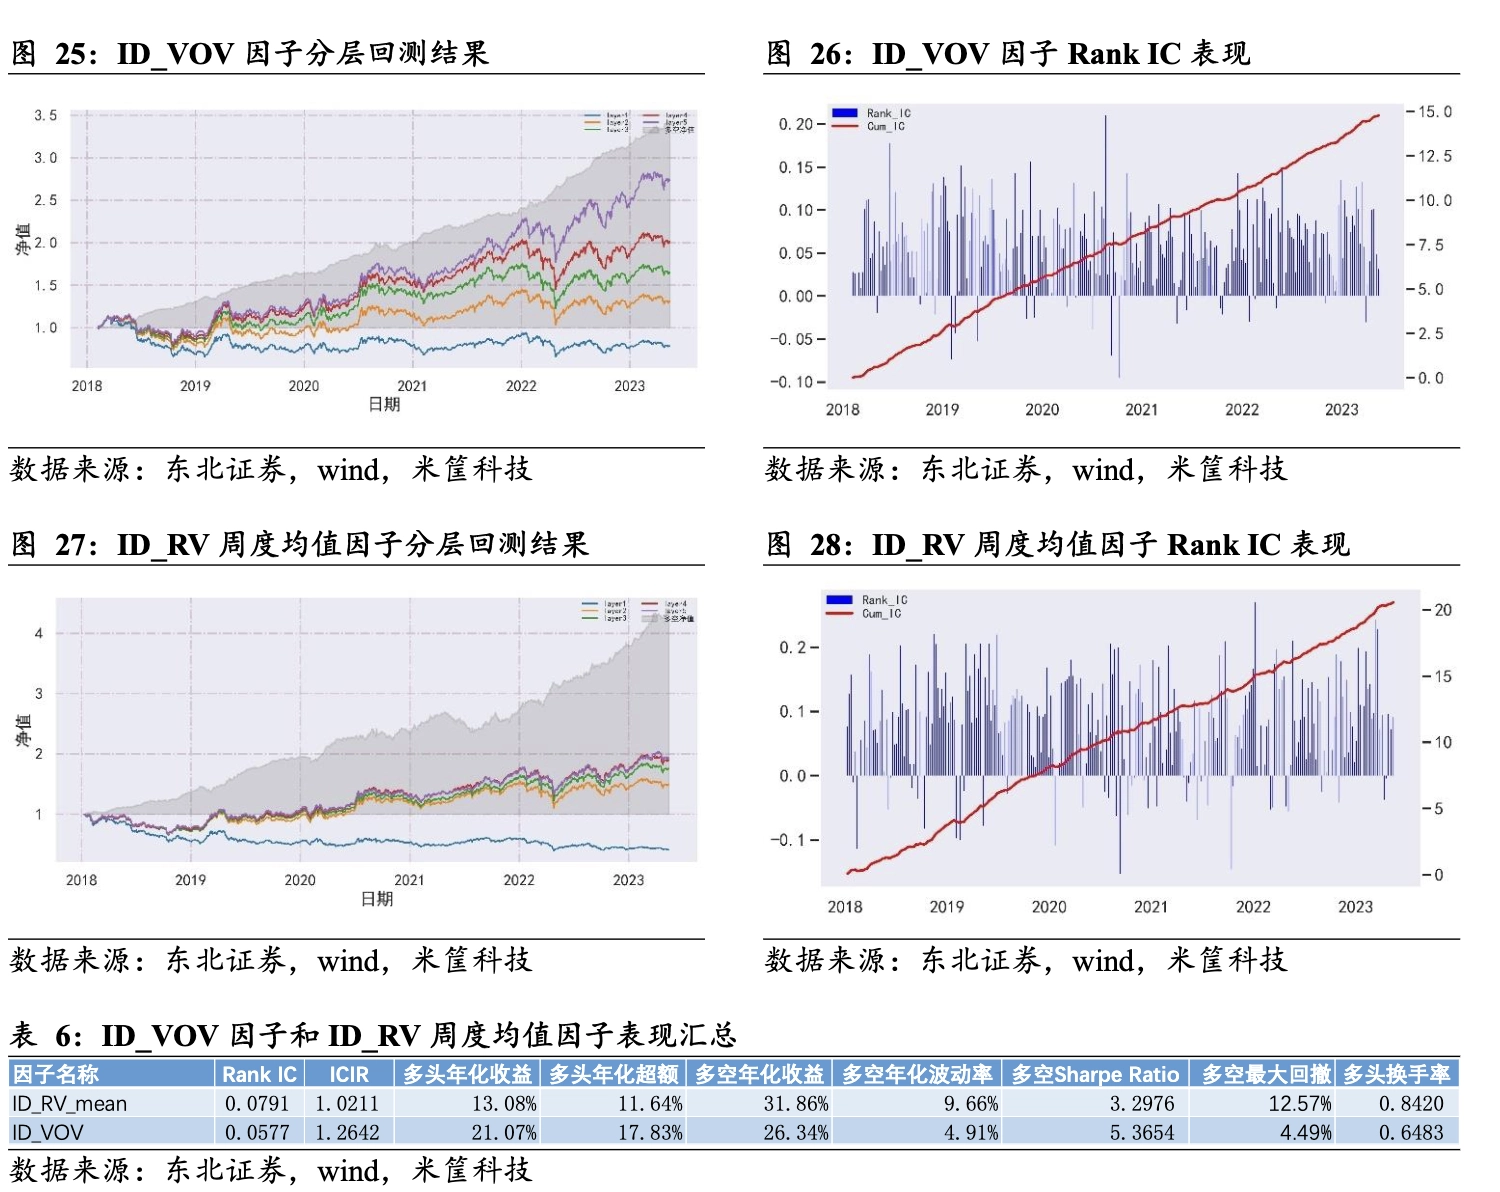
Caitong Securities constructs a idiosyncratic skewness factor based on 5min high-frequency data, and the average RankIC value reaches -9.5%[6]. Northeast Securities[3] calculated the idiosyncratic return improved risk factor (RV) and risk uncertainty factor (VOV) based on high-frequency data, and the stock selection performance has improved to a certain extent compared to the original factors.
Expand and enhance
Volatility Clustering
Volatility aggregation phenomenon - Academic research shows that time series data of financial asset returns usually exhibit volatility aggregation phenomenon. This phenomenon exists at the individual stock level, resulting in a strong inter-temporal cross-sectional correlation in the stock’s volatility factor. In response to this phenomenon, literature [4][5] gives completely opposite treatment methods.
Soochow Securities believes that when using traditional volatility factors for monthly stock selection, the reused past factor information due to this correlation will cause interference to us and weaken the stock selection effect of the current factor. The solution given is to perform a multiple linear regression on the factor values of this month against the factor values of the past 6 months at the end of each month, and take the residual as the “naive volatility”. The conclusion is that the stock selection effects of pure volatility factors after excluding cross-sectional correlations of different orders are better than traditional idiosyncratic volatility factors.
Minsheng Securities uses the GARCH(1,1) model to describe the volatility aggregation of the return sequence, making the estimated volatility more reliable, and uses model estimates to replace historical volatility as a factor. The performance of IVOL_garch factor has been significantly improved compared to IVOL. The test found that under general market conditions, the idiosyncratic volatility predicted by the GARCH model is almost the same as the historical idiosyncratic volatility. However, during periods of large market fluctuations (especially bull market periods when volatility factors retrace themselves), the idiosyncratic volatility predicted by the GARCH model can more accurately identify large changes in volatility.
Neutral pricing efficiency
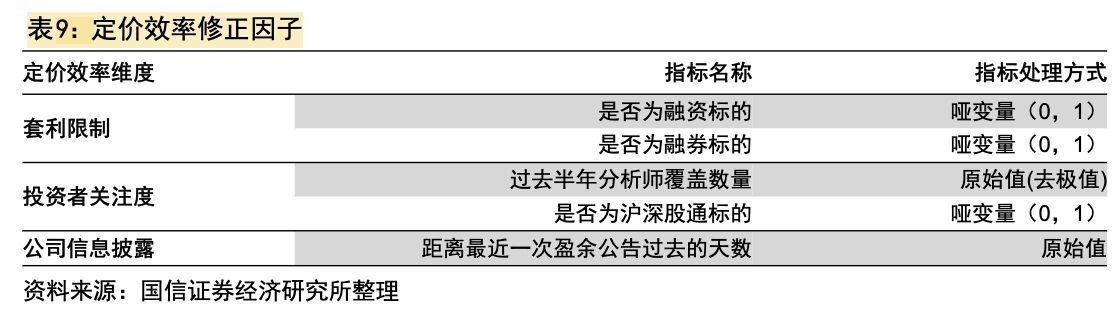
Guosen Securities conducts cross-sectional regression on the composite idiosyncratic factor of the pricing efficiency correction factor in the table, and takes the residual as the composite idiosyncratic factor after the pricing efficiency factor is corrected. The stability of the factor is improved. However, combined with the conclusion of [1], this article believes that the direct nonlinear relationship between the two should be considered instead of simply eliminated.
Characteristic sequences of other indicators
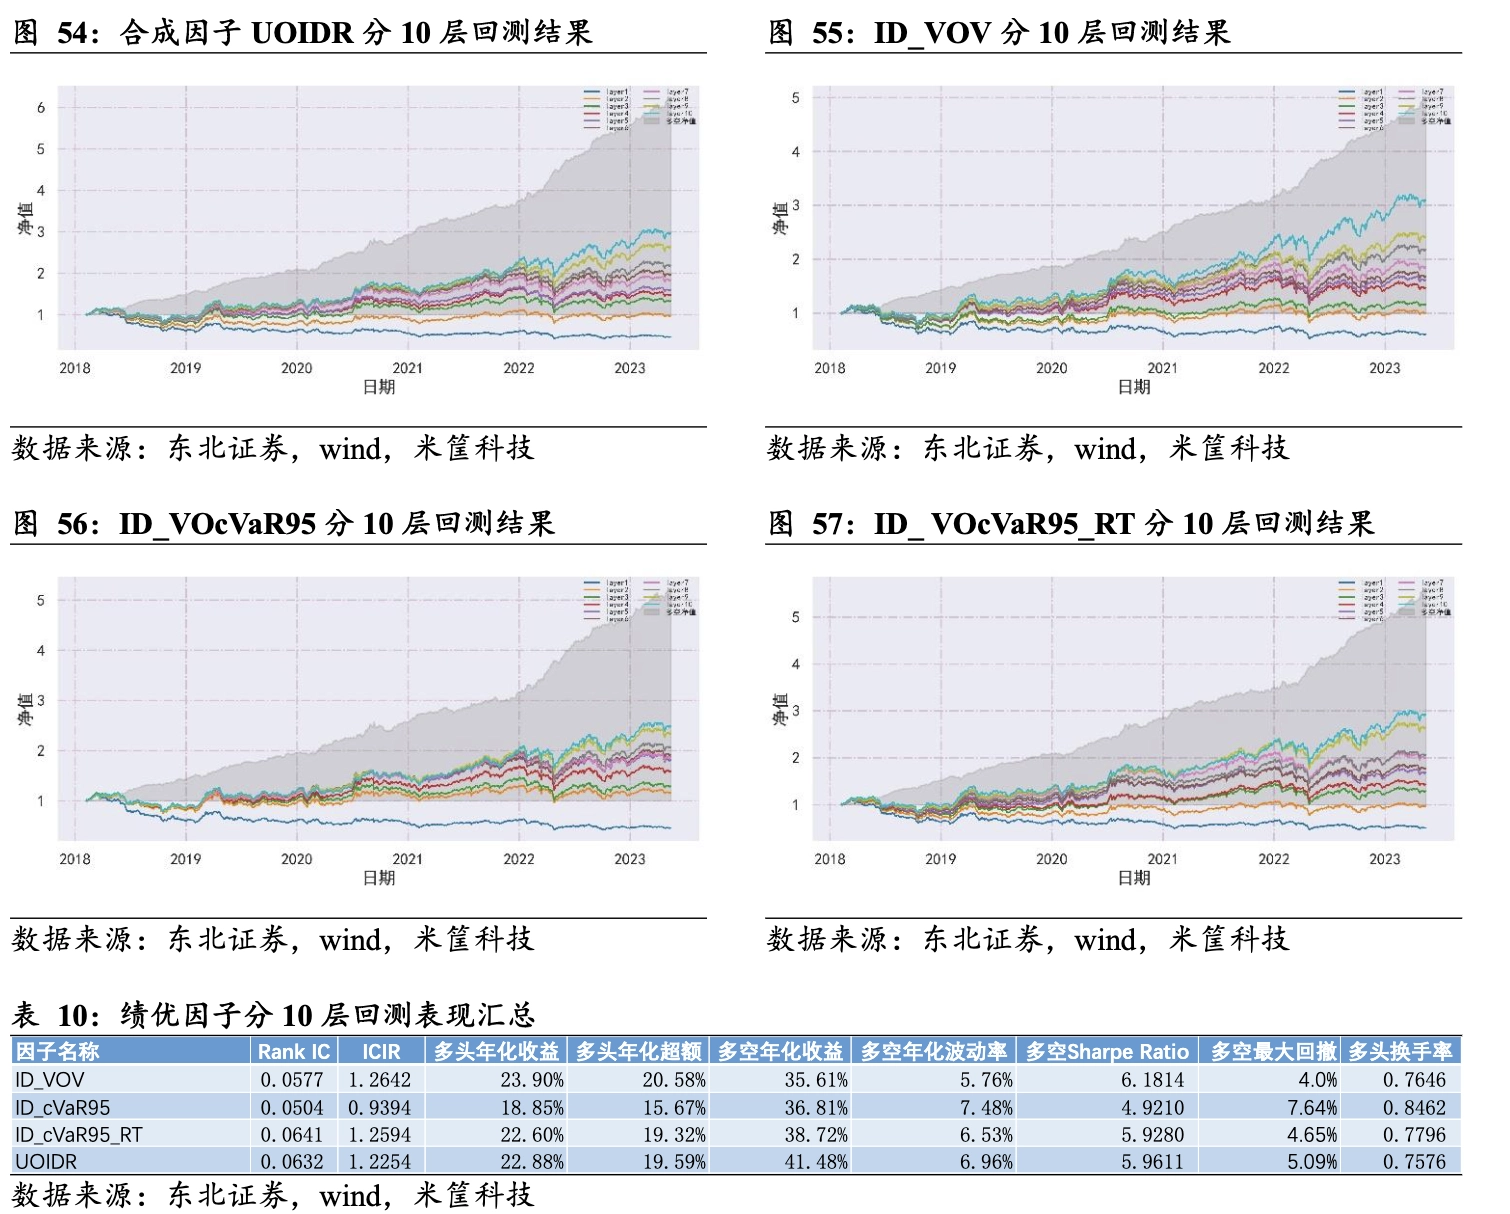
Compared with the original multi-factor model, the extraction of the maximum common volatility under the principal component analysis method can not only be limited to daily return series, but can also be extended to other indicators such as intraday returns, overnight returns, and turnover rates, and corresponding idiosyncratic volatility factors can be constructed.
References
[1.] Stambaugh, Yu and Yuan, “Arbitrage Asymmetry and the Idiosyncratic Volatility Puzzle”.
[2.]20220817-Guosen Securities-Special Research on Financial Engineering: Improvement of Trait Factors under the Implicit Framework
[3.]20230601-Northeast Securities-Factor stock selection series No. 5: Risk uncertainty factors based on high-frequency data
[4.]20200528-Soochow Securities-“Volatility Stock Selection Factors” Series Research (1): Looking for pure information in idiosyncratic volatility - pure volatility excluding intertemporal cross-sectional correlation
[5.]20190520-Minsheng Securities-Low Volatility Anomaly: Analysis, Improvement and Empirical Causes
[6.]20191210-Caitong Securities-Gaming preference or risk compensation? Full analysis of high-frequency idiosyncratic skewness factors
A New Branch of Price-Volume Factors: An Introduction to Idiosyncratic Risk Factors