Three Measures of Correlation: From Linear to Nonlinear
This article introduces three indicators for measuring the correlation of variables: Pearson correlation coefficient, Spearman correlation coefficient and Chatterjee correlation coefficient. The last one can easily measure non-linear correlation relationships.
Pearson correlation coefficient is used to measure the linear correlation between random variables X and Y. It is defined as the covariance ratio of X and Y to their respective standard deviations.
$$ \rho_{X,Y} = \frac{cov(X,Y)}{\sigma_X\sigma_Y}=\frac{E[(X-\mu_X)(Y-\mu_Y)]}{\sigma_X\sigma_Y} $$
Covariance measures the correlation between X and Y offsets from their respective means and will not be affected by translation. Dividing by the standard deviation ensures that it is not affected by scaling. The value range of the Pearson correlation coefficient is \([-1,1]\). When the value is greater than 0, it means a positive correlation, and vice versa. The larger the absolute value, the stronger the linear relationship. When it is equal to 0, it means there is no linear correlation.
Spearman correlation coefficient is also called the rank correlation coefficient. It first converts X and Y into rank (ranking) sequences R(X), R(Y), and then calculates the Pearson correlation coefficient.
$$ r_s=\rho_{R(X),R(Y)} $$
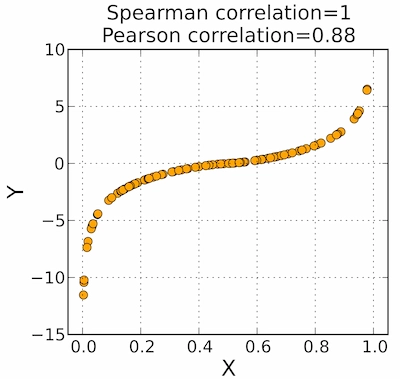
The advantage of this is that it avoids the influence of extreme values and does not require linear correlation of the original values. The following three comparison pictures provide a good comparison between the two.
- The rank correlation coefficient in Figure 1 accurately reflects that Y completely changes with X
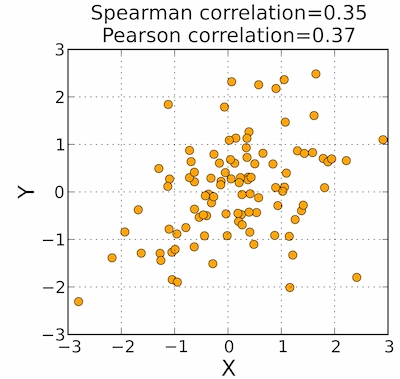
- The two are similar in Figure 2
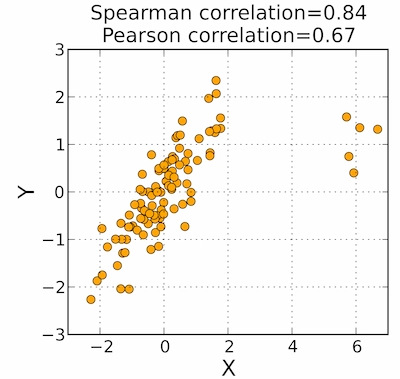
- The rank correlation coefficient in Figure 3 is not affected by outliers, reflecting that X and Y are highly correlated, while the Pearson correlation coefficient is only 0.67
The above two correlation coefficients can only describe linear correlation and are powerless in the face of nonlinear functions such as \(y=x^2\). Therefore, people have proposed the maximum mutual information coefficient MIC of the nonlinear correlation analysis algorithm, but the computational complexity has increased by several orders of magnitude, and the effect is unsatisfactory. What people want is actually such an indicator
- Be as simple as Pearson correlation coefficient or Spearman correlation coefficient
- A simple and interpretable measure that can always accurately estimate the degree of dependence between variables. This measure is 0 if and only when the variables are independent, and is 1 if and only if one is a measurable function of the other.
- Have a simple asymptotic theory under the assumption of independence, similar to classical coefficients
Is there such a good thing? There really is! The third indicator to be introduced in this article is the Chatterjee Correlation Coefficient (CCC) proposed in 2019. Suppose \((X_1, Y_1), \ldots, (X_n, Y_n)\) are independently and identically distributed, where \(n \geq 2\), and \(X_i\) and \(Y_i\) do not have any equal values. Rearrange the data into \((X(1), Y(1)), \ldots, (X(n), Y(n))\) such that \(X(1) \leq \ldots \leq X(n)\). Let \(r_i\) be the rank of \(Y(i)\), that is, the number of \(j\) of \(Y(j) \leq Y(i)\). The new correlation coefficient is defined as follows:
$$ \xi_{n}(X, Y):=1-\frac{3 \sum_{i=1}^{n-1}\left|r_{i+1}-r_{i}\right|}{n^{2}-1} $$
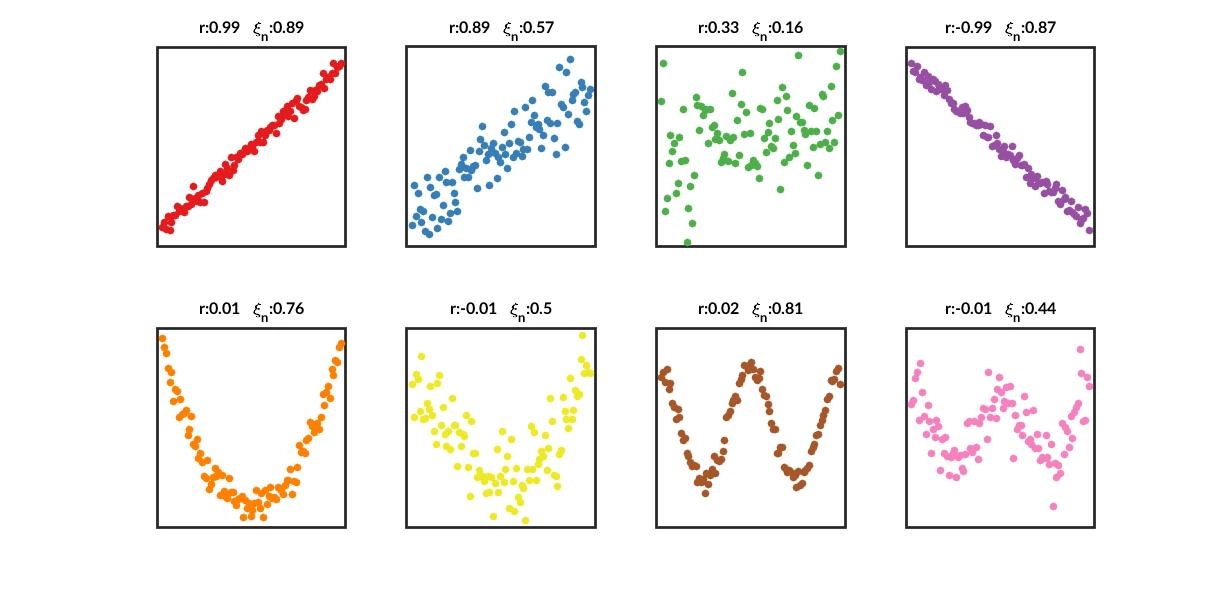
The intuitive understanding is that the Chatterjee correlation coefficient measures whether adjacent \(Y_i\) are similar after sequentially arranging \(X_i\). For detailed theoretical proof, see the original text [1]. It is worth noting that this indicator is not symmetrical and is intentional by the author. When calculating the correlation, it is necessary to calculate the maximum value twice. The indicator effect is shown in the figure below. Compared with the Pearson correlation coefficient, it can identify nonlinear correlation, but it underestimates the linear correlation.
The python implementation is given below
1 | import numpy as np |
[1.] Chatterjee, Sourav. 2021. “A New Coefficient of Correlation”. Journal of the American Statistical Association 116 (536): 2009–22. https://doi.org/10.1080/01621459.2020.1758115.
Three Measures of Correlation: From Linear to Nonlinear