Building Statistical Arbitrage Portfolios with Correlation-Matrix Clustering: A Graph-Clustering Framework
The core of a statistical arbitrage strategy lies in identifying and exploiting temporary deviations in asset prices. Traditional approaches such as pairs trading are well known, but scaling them efficiently to large asset universes while preserving robustness has remained difficult. A recent Oxford research paper, Correlation Matrix Clustering for Statistical Arbitrage Portfolios, proposes an innovative framework: apply graph clustering algorithms to the correlation matrix of stock residual returns, then build mean-reverting statistical arbitrage portfolios inside each cluster. Empirical results show that the method can generate annualized returns above 10% with Sharpe ratios significantly greater than 1.
Reference: Cartea, A., Cucuringu, M., & Jin, Q. (2023). Correlation Matrix Clustering for Statistical Arbitrage Portfolios. SSRN. https://ssrn.com/abstract=4560455
Core Framework
The core workflow is straightforward and contains two main stages.
- Cluster similar stocks. A specific notion of “similarity” is computed across assets, based mainly on the correlation of residual returns in the paper, and graph clustering algorithms are then used to partition stocks into groups whose internal dependence is strong.
- Trade inside each cluster. A mean-reversion statistical arbitrage portfolio is deployed within every identified cluster.
Constructing the Similarity Measure
The similarity in the paper is defined from historical return series. To strip out overall market fluctuations and focus on idiosyncratic stock movement, the paper first computes market residual returns
$$ R_{i,t}^{res} = R_{i,t} - \beta_i R_{mkt,t} $$
where- \(R_{i,t}\): the raw return of stock \(i\) at time \(t\).
- \(\beta_i\): the CAPM beta of stock \(i\), estimated on a rolling 60-day window.
- \(R_{mkt,t}\): the market return, proxied by SPY ETF returns.
Next, the correlation matrix \(\mathbf{C}\) is computed from those residual returns. The entry \(C_{ij}\) is the Pearson correlation coefficient between residual returns of stocks \(i\) and \(j\) over a lookback window \(w\):
$$ C_{i,j} = \frac{\sum_{t=T-w}^{T-1} (R^{res}_{t,i} - \bar{R}^{res}_{i}) (R^{res}_{t,j} - \bar{R}^{res}_{j})}{(w-1) \sigma_i \sigma_j} $$
where:
- \(\bar{R}^{res}_{i}\): the mean residual return of stock \(i\) over the \(w\)-day window.
- \(\sigma_i\): the standard deviation of stock \(i\)’s residual return over that window.
- \(w\): the lookback-window length. In the paper, \(w=5\) days is used to build the correlation matrix.
Applying Graph Clustering Algorithms
The correlation matrix \(\mathbf{C}\) can be viewed as a weighted signed network: stocks are nodes, and correlations are edge weights, which may be positive or negative.
The paper systematically compares five graph clustering algorithms that can handle negative weights:
SPONGE (Signed Positive Over Negative Generalized Eigenproblem). It optimizes the ratio of positive to negative cuts through a generalized eigenvalue problem and introduces regularization to avoid tiny clusters. The formulation begins by decomposing the adjacency matrix into positive and negative parts \(A^+\) and \(A^-\) and forming the Laplacians \(L^+\) and \(L^-\):
$$ A = A^+ - A^-, \quad L^+ = D^+ - A^+, \quad L^- = D^- - A^- \quad \text{} $$
The final step solves the generalized eigenvalue problem \((L^+ + \tau^{-}D^-)v = \lambda (L^- + \tau^{+}D^+)v\), and the first \(K\) generalized eigenvectors are passed into k-means++.
\(SPONGE_{sym}\), the symmetrically normalized variant of SPONGE, uses symmetrically normalized Laplacians and is more robust when degree distributions are uneven:
$$ (L^{+}_{sym} + \tau^{-}I)v = \lambda (L^{-}_{sym} + \tau^{+}I)v $$
Spectral Clustering (unsigned). A traditional spectral clustering method that takes the absolute correlation matrix \(|C|\) as the adjacency matrix, which discards negative-correlation information, and then clusters using the standard graph Laplacian \(L = D - |A|\).
Signed Laplacian \(SignedLaplacian_{sym}\). Clustering based on the symmetrically normalized signed Laplacian \(\bar{L}_{sym} = I - \bar{D}^{-1/2}A\bar{D}^{-1/2}\).
Signed Laplacian \(SignedLaplacian_{rw}\). Clustering based on the random-walk normalized signed Laplacian \(\bar{L}_{rw} = I - \bar{D}^{-1}A\).
Constructing Statistical Arbitrage Portfolios Within Each Cluster
Inside each stock cluster \(j\), the strategy is built from the past \(w\) days of raw returns. The paper finds that the resulting portfolios remain market neutral in practice.
Compute the cluster-average return
$$ \bar{R}_{j,t} = \frac{1}{j_n} \sum_{i=1}^{j_n} R_{i,t} \quad \text{} $$
where \(j_n\) is the number of stocks in cluster \(j\).
Identify previous winners and previous losers
Previous Winners satisfy \(\sum_{t=T-w}^{T-1} (R_{i,t} - \bar{R}_{j,t}) > p\), where the paper sets \(p=0\), meaning the stock’s recent cumulative return is above the cluster average.
Previous Losers satisfy \(\sum_{t=T-w}^{T-1} (R_{i,t} - \bar{R}_{j,t}) < -p\), meaning the stock’s recent cumulative return is below the cluster average.
Build a contrarian portfolio. Go long all previous losers and short all previous winners.
Assign weights. Within each cluster, the portfolio is initialized to zero net dollar value, with equal notional long and short books. For example, if a cluster has 2 winners and 4 losers, each winner receives a short weight of \(0.5\) and each loser receives a long weight of \(0.25\).
Holding and rebalancing. The portfolio is held for \(\ell\) days, with \(\ell=3\) in the paper. A take-profit threshold \(q\) is also imposed, with \(q=5%\) in the paper. If the portfolio reaches that return early, rebalancing is triggered immediately. Once the holding period ends or the take-profit is hit, the correlation matrix is recomputed, clusters are rebuilt, and the portfolio is reconstructed.
Key Innovation: Graph Clustering on Correlation Structure
This framework does not follow the usual route of clustering residual-return vectors directly with standard methods such as k-means. Instead, it focuses on graph-structural analysis of the correlation matrix. That design reflects an important insight into statistical arbitrage: the relative movement pattern among assets, their co-movement structure, defines similarity better than the absolute level of returns does. The main advantages are discussed below.
A Shift in the Optimization Target
| Method | Objective Function | Feature |
|---|---|---|
| K-means clustering | \(\min \sum_{k=1}^K \sum_{\mathbf{r}_i \in C_k} |\mathbf{r}_i - \boldsymbol{\mu}_k|^2\) | Relies on Euclidean distance and assumes similarity means closeness in return magnitude |
| Graph clustering | \(\max \frac{\sum_{i,j \in \text{same cluster}} C_{ij}^+}{\sum_{i,j} \in \text{different clusters}} |C_{ij}^-|\) | Directly optimizes correlation structure and captures co-movement |
Ability to Handle Negative Correlation
Graph clustering explicitly optimizes positive and negative edge cuts, as in SPONGE:
$$ (\mathbf{L}^+ + \tau^{-}\mathbf{D}^-) \mathbf{v} = \lambda (\mathbf{L}^{-} + \tau^{+}\mathbf{D}^+) \mathbf{v} $$
K-means, by contrast, cannot distinguish negative correlation from weak correlation, causing important hedging opportunities to be lost.
Noise Robustness
Residual-return vectors \(\mathbf{r}_i \in \mathbb{R}^T\) are usually high-dimensional and noisy. Applying k-means directly to them creates several problems:
- Curse of dimensionality: when \(T\) is large, sample sparsity weakens distance metrics.
- Noise amplification: noise in returns can strongly distort Euclidean distance.
- Lack of time-shift invariance: k-means cannot capture delayed dependence such as stock A leading stock B.
Graph clustering suppresses noise in two steps:
- Matrix averaging. The computation of \(C_{ij}\) naturally smooths short-term fluctuations.
- Spectral embedding. Eigen-decomposition of \(\mathbf{C}\) through equations like \(\mathbf{L} \mathbf{u} = \lambda \mathbf{D} \mathbf{u}\) maps nodes into a low-dimensional space \([u_1(i),…,u_K(i)] \downarrow\) before clustering. This suppresses high-frequency noise and preserves stable topology.
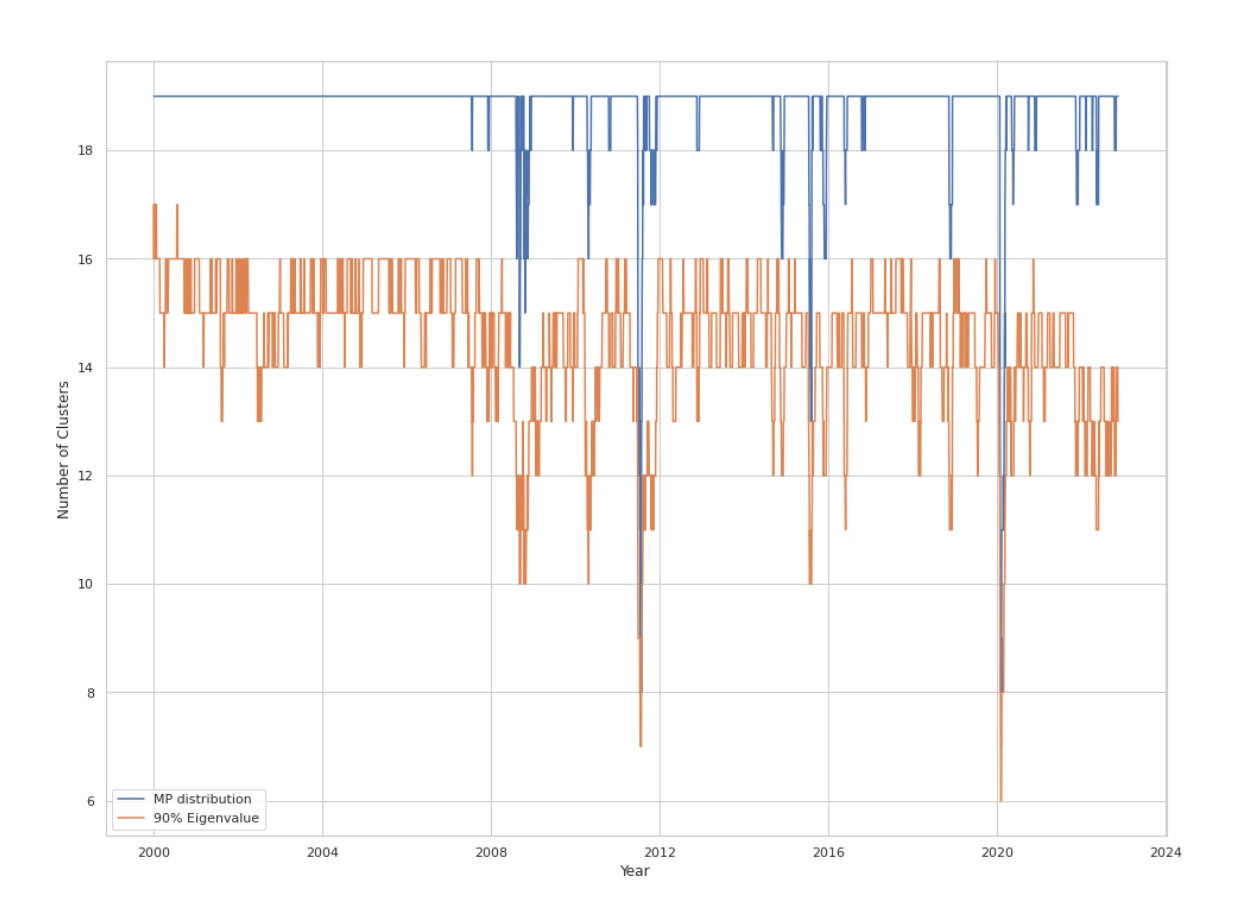
Key Innovation: Determining the Number of Clusters K Dynamically
The choice of cluster number \(K\) is crucial. The paper proposes a dynamic framework for selecting \(K\) rather than fixing it, for example at 30. The dynamically chosen \(K\) values drop sharply during episodes of market stress, such as the 2008 financial crisis, the 2011 U.S. debt downgrade episode, and the early 2020 COVID shock, reflecting changes in market risk structure and co-movement patterns.
The Marchenko-Pastur (MP) Method
Based on random matrix theory:
Compute the empirical correlation matrix \(C = \frac{1}{T}X^{T}X\) from the residual-return matrix \(X\) with shape \(T\) days by \(N\) stocks.
The Marchenko-Pastur law describes the limiting eigenvalue distribution \(f(\lambda)\) of \(C\) under standard assumptions such as \(N, T \to \infty\) with fixed ratio \(\rho=N/T\):
$$ f(\lambda) = \begin{cases} \frac{\sqrt{(\lambda_{+}-\lambda)(\lambda-\lambda_{-})}}{2\pi\lambda\sigma^2\rho} & \text{for } \lambda \in [\lambda_{-}, \lambda_{+}] \\ 0 & \text{otherwise} \end{cases} \quad \text{} $$
where \(\lambda_{\pm} = \sigma^2(1 \pm \sqrt{\rho})^2\). If returns are standardized so that \(\sigma^2=1\), then \(\lambda_{\pm} = (1 \pm \sqrt{\rho})^2\).
\(K\) is set equal to the number of eigenvalues of the empirical correlation matrix \(C\) that exceed the theoretical upper bound \(\lambda_{+}\). These outlier eigenvalues are interpreted as significant non-random structure or dominant market factors.
Cumulative Variance Explained (90% Eigen)
Order the eigenvalues of the correlation matrix \(C\) in descending order, \(\lambda_1 \ge \lambda_2 \ge … \ge \lambda_N\).
\(K\) is set to the smallest \(k\) such that \(\frac{\sum_{i=1}^{k} \lambda_i}{\sum_{i=1}^{N} \lambda_i} \ge P\), where the paper uses \(P=0.9\), meaning 90% of total variance is explained.
Empirical Results: Strong and Robust Performance
The study backtests the strategy on the top 25% of U.S. stocks by market capitalization from the CRSP database over 2000 to 2022, roughly 600 stocks per day.
Performance
| Model | MP AR | MP SR | MP ST | 90% Eigen AR | 90% Eigen SR | 90% Eigen ST | Fixed K AR | Fixed K SR | Fixed K ST |
|---|---|---|---|---|---|---|---|---|---|
| SPONGE | 10.99 | 1.02 | 1.81 | 11.90 | 1.07 | 1.89 | 10.21 | 1.01 | 1.80 |
| SPONGE\(_{sym}\) | 12.05 | 1.11 | 2.01 | 12.20 | 1.10 | 2.01 | 10.40 | 1.03 | 1.80 |
| Spec | 10.96 | 1.03 | 1.82 | 10.84 | 0.98 | 1.75 | 10.03 | 0.99 | 1.72 |
| Lap\(_{sym}\) | 11.19 | 0.91 | 1.60 | 11.24 | 0.88 | 1.55 | 11.10 | 0.97 | 1.66 |
| Lap\(_{rw}\) | 10.38 | 0.85 | 1.47 | 11.26 | 0.90 | 1.56 | 10.95 | 0.96 | 1.64 |
| FF12 | - | - | - | - | - | - | 10.13 | 1.08 | 1.90 |
| SPY | - | - | - | - | - | - | 6.59 | 0.32 | 0.50 |
Main metrics: annualized return (AR), Sharpe ratio (SR, with risk-free rate assumed to be 0), and Sortino ratio (ST).
Benchmark strategies: SPY ETF as the market benchmark, and FF12 as a strategy that applies the same within-cluster mean-reversion logic inside the Fama-French 12 industry classification, treating industries as the clusters.
All clustering-based arbitrage strategies, regardless of the method used to choose \(K\), achieve annualized returns above 10%, clearly outperforming the SPY market benchmark at roughly 6.59%.
Across clustering algorithms, \(SPONGE_{sym}\) performs best overall, especially with dynamic \(K\) selection, reaching annualized returns above 12%, Sharpe ratios above 1.1, and Sortino ratios near or above 2.0.
Dynamic \(K\) selection performs slightly better than fixing \(K=30\), indicating that the dynamic approach provides some market adaptivity.
Market Neutrality Verification
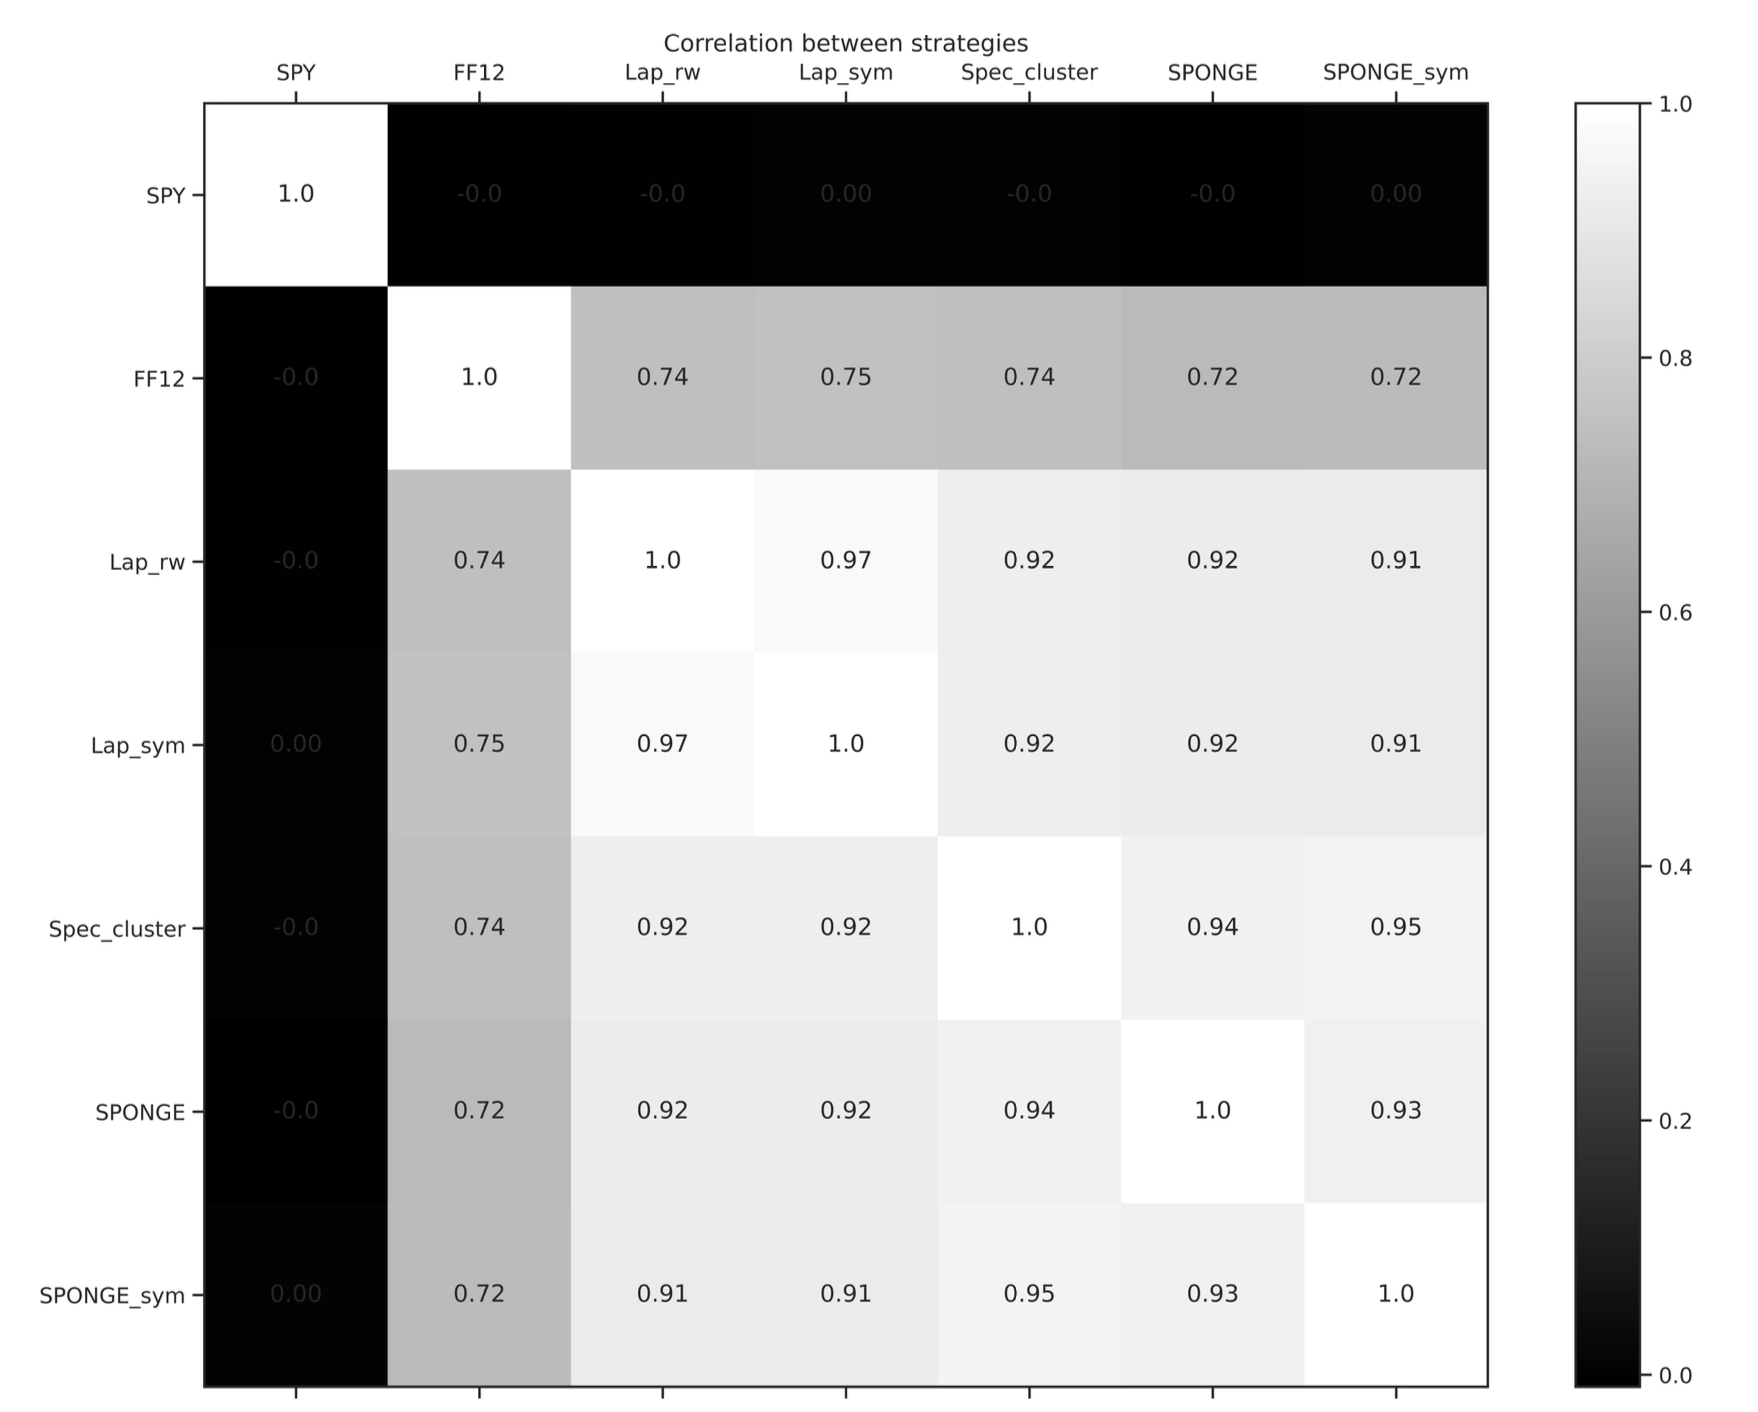
- The correlation matrix of strategy returns shows that the return series of all statistical arbitrage strategies have correlations close to zero with SPY ETF returns. This strongly confirms their market-neutral nature.
- Returns from strategies driven by different graph-clustering algorithms are highly correlated with each other, indicating that they are capturing similar mean-reversion patterns.
Effects Beyond Industry Classification
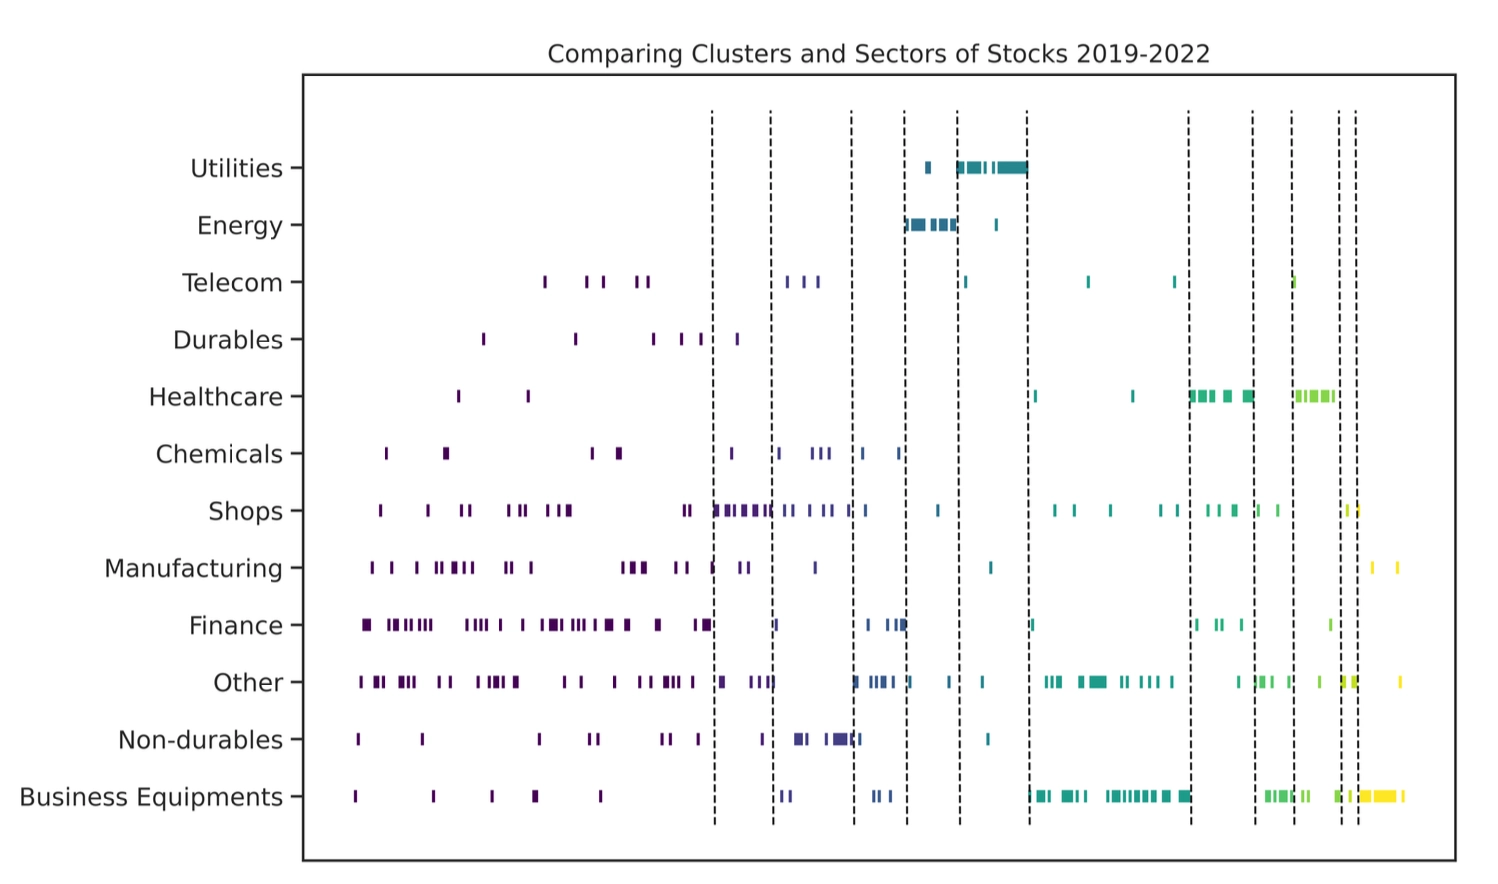
The clusters found by the SPONGE algorithm overlap only partially with particular industries such as utilities, energy, business equipment, and health care, while many large clusters include stocks from multiple industries.

The paper uses the Adjusted Rand Index (ARI) to quantify similarity between the clustering output and FF12 industry labels. For all clustering algorithms, the ARI remains below 15%.
At the same time, the returns of these clustering strategies are only weakly correlated with the FF12 industry strategy.
Together, this evidence shows that the framework’s excess returns cannot be fully explained by conventional within-industry mean-reversion effects. The clustering method successfully discovers newer and more cross-industry arbitrage opportunities.
Conclusion
The statistical arbitrage framework based on graph clustering of correlation matrices shows several clear advantages.
- An efficient asset-grouping mechanism. Graph clustering algorithms, especially the SPONGE family, can effectively identify groups of stocks with similar residual-return behavior from high-dimensional correlation data.
- Strong profitability. A simple contrarian rule, long losers and short winners inside each cluster, is enough to generate annualized returns above 10%, with excellent risk-adjusted performance, including Sharpe ratios above 1 and Sortino ratios above 1.8.
- Reliable market neutrality. By modeling residual returns and constructing dollar-neutral portfolios, strategy returns remain nearly uncorrelated with the market benchmark SPY, showing solid hedging effectiveness.
- An alpha source beyond traditional industry boundaries. The mean-reversion patterns captured by the strategy differ significantly from those implied by fixed industry classifications, proving that the framework discovers new and independent sources of alpha.
- A dynamic and robust design. The mechanism that adjusts the cluster count \(K\) dynamically through random matrix theory makes the entire framework fairly robust to both the precise choice of \(K\) and the type of clustering algorithm used.
Implications and Outlook: Expanding the Dimensions of “Similarity”
This research provides a powerful practical framework for quantitative investing. Its core idea, using data-driven methods to identify the structure of similarity among assets and building trading strategies on that basis, has broad applicability and strong room for future development. In particular, there is substantial scope for extending how asset “similarity” is defined and measured.
Extensions to the definition of residual return
The paper mainly uses CAPM to remove market factors and obtain residual returns. But the way one constructs “idiosyncratic” or “residual” returns is itself highly flexible. For example, one could use purely statistical approaches such as principal component analysis (PCA) to identify and strip out common market risk from raw returns, where principal components play the role of latent risk factors. That would generate residual-return series from a different perspective and may capture asset-specific dynamics different from those highlighted by CAPM.Extending the similarity measure with custom embeddings
- The current framework feeds the correlation matrix of residual returns into the clustering algorithm. Future work can expand the meaning of “similarity” even further. One need not stop at simple linear correlation. Inspired by modern factor investing and machine learning, especially deep learning, one can introduce richer custom asset embeddings to represent stocks.
- For instance, one could combine fundamentals such as accounting metrics, alternative data such as news sentiment, patent data, supply-chain links, and analyst reports, as well as high-frequency trading features, and then use deep-learning models such as autoencoders, Transformers, or graph neural networks to learn low-dimensional dense embeddings for each stock.
- These learned embeddings can capture more complex and deeper asset characteristics and relation patterns. Similarity or distance between stocks can then be computed from the embeddings using cosine similarity, Euclidean distance, or more elaborate kernel functions, and the resulting matrix can be fed into the graph clustering algorithm as a new similarity matrix.
- This opens a broad research space for discovering asset clusters from more diverse and more fundamental dimensions, for example similar business models, similar risk exposures, similar growth logic, similar patterns of investor attention, or upstream and downstream positions in industrial supply chains. Such approaches may uncover arbitrage opportunities that standard correlation analysis cannot easily detect.
Extensions to other parts of the framework
- Continued innovation in clustering algorithms. One can keep exploring and evaluating newer and more sophisticated graph clustering or community-detection methods, especially those that handle dynamic networks, heterogeneous information, or improved interpretability.
- Improved portfolio construction within clusters. Beyond a simple contrarian mean-reversion rule, more refined portfolio-optimization techniques can be applied inside clusters, such as cointegration-based construction, risk-parity approaches, or differentiated weighting schemes that also use momentum, volatility, or other cluster-level features.
- Cross-asset and high-frequency applications. As the paper itself suggests, the framework could be extended to other asset classes such as cryptocurrencies, FX, or commodities, as well as to cross-asset correlation analysis and higher-frequency data such as minute or tick data to mine very short-term mean-reversion opportunities.
Overall, this work not only provides a systematic and operationally useful framework and toolkit for statistical arbitrage research, but also sets a new benchmark for evaluating and applying graph clustering algorithms in financial-market analysis. Its flexible definition of asset similarity and data-driven discovery process point toward substantial room for ongoing innovation in this direction.
Building Statistical Arbitrage Portfolios with Correlation-Matrix Clustering: A Graph-Clustering Framework